How to Read the Sentiment vs Price Chart
Understand the overlay chart that shows how market sentiment correlates with asset price over time.

What is the Sentiment vs Price Chart?
The Sentiment vs Price overlay chart is SentiSignal's core visualization. It places market sentiment scores (derived from news analysis) on the same timeline as the asset price, so you can instantly see how they relate.
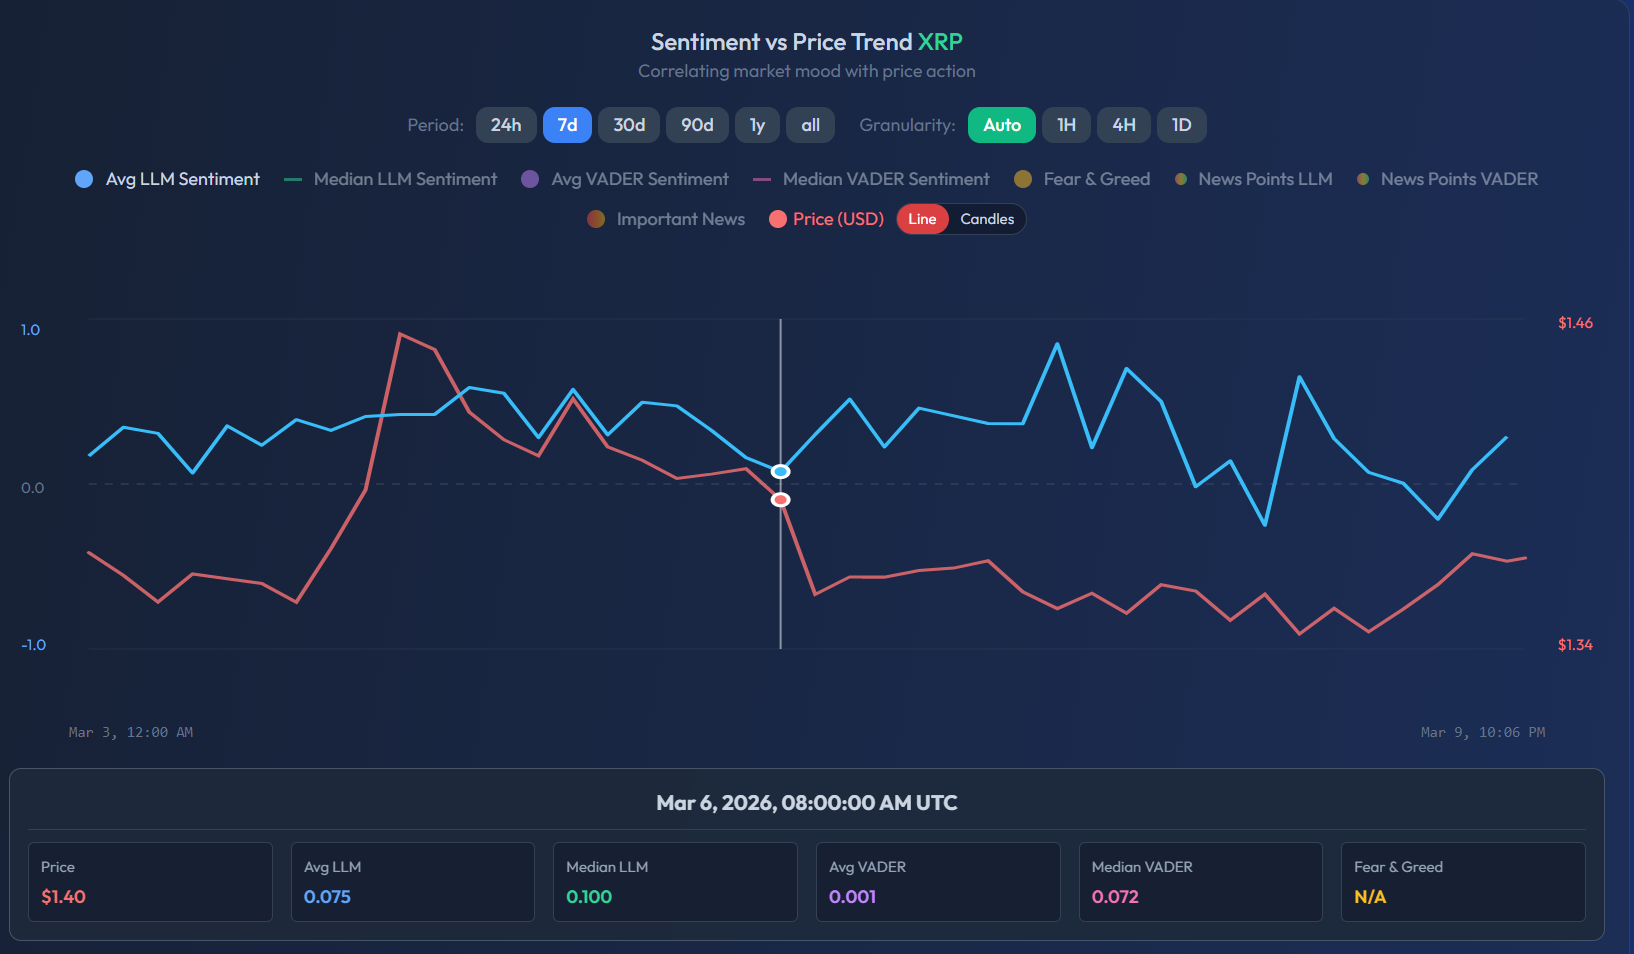
The Chart Legend
There are up to 8 data series you can toggle on or off:
- Avg LLM Sentiment (blue solid) — Average sentiment score from AI language model analysis across all news in the selected window.
- Median LLM Sentiment (teal dashed) — Median score, more resistant to outliers. Use this when you suspect a single viral story is skewing the average.
- Avg VADER Sentiment (purple solid) — Average sentiment from VADER, a rule-based algorithm. Faster but less context-aware than LLM.
- Median VADER Sentiment (pink dashed) — Median VADER score.
- Fear & Greed (yellow) — Crypto Fear & Greed Index (0–100). Low values = Extreme Fear; high values = Extreme Greed.
- News Points LLM / VADER (scatter dots) — Each dot represents one news article, plotted at the time it was published.
- Important News (orange dots) — Only the highest-importance articles highlighted.
- Price (USD) (red) — The asset price line or candlesticks.
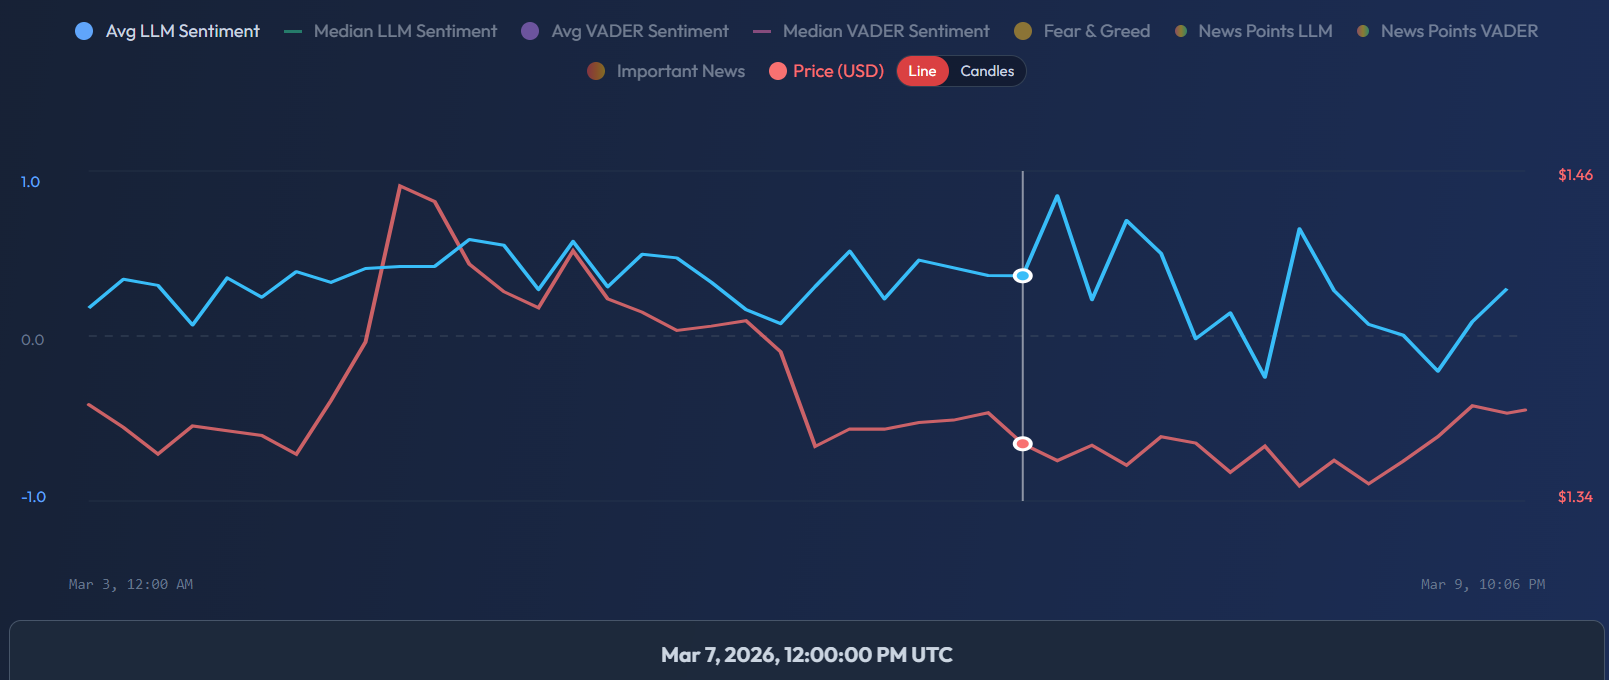
Reading Sentiment vs Price
The key insight is the direction relationship:
- When the blue sentiment line rises before the red price line, sentiment is leading — it may be predictive.
- When they move together, they are synchronized.
- When sentiment falls after price already dropped, it is lagging — media is reacting, not predicting.
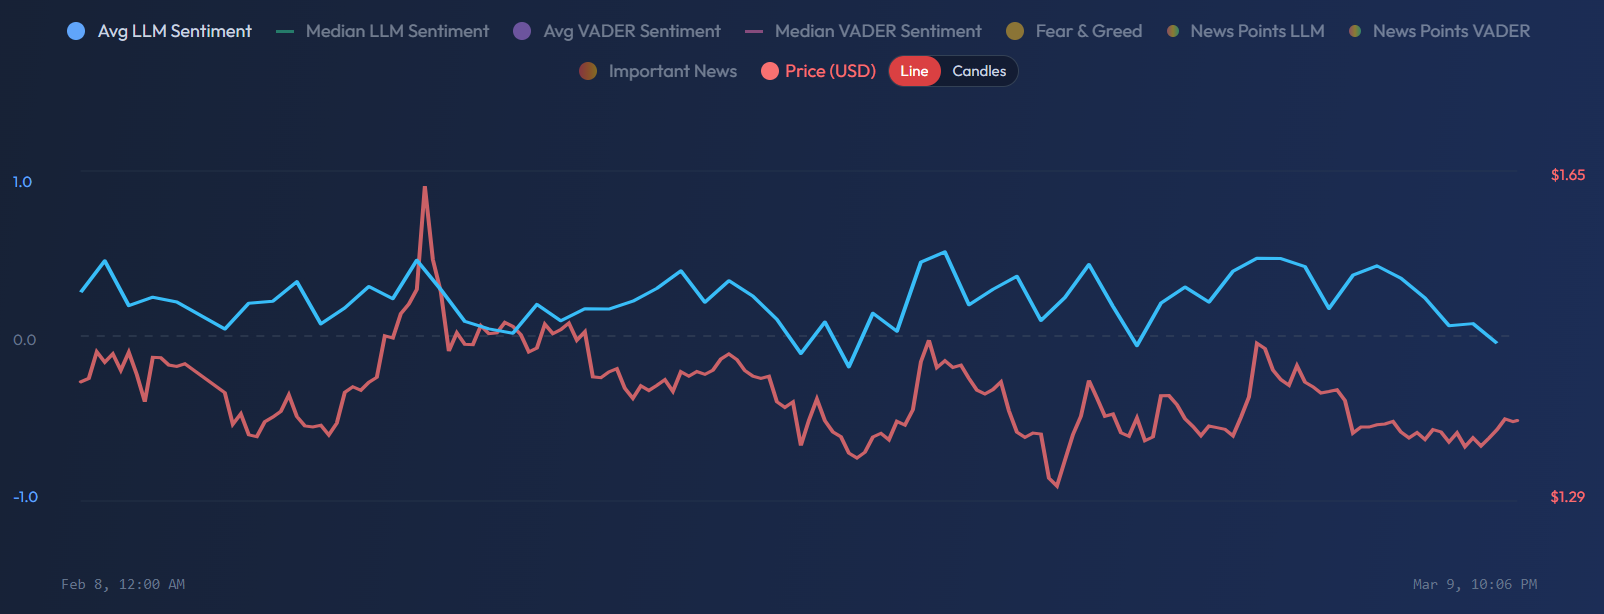
Period and Granularity Selectors
At the top of the chart you can choose:
- Period: 24h, 3d, 7d, 90d, 1y, All — the time window displayed
- Granularity: Auto (recommended), 1h, 4h, 1d — how data points are grouped
Use Auto granularity for most analysis — it adjusts automatically based on the period you selected.
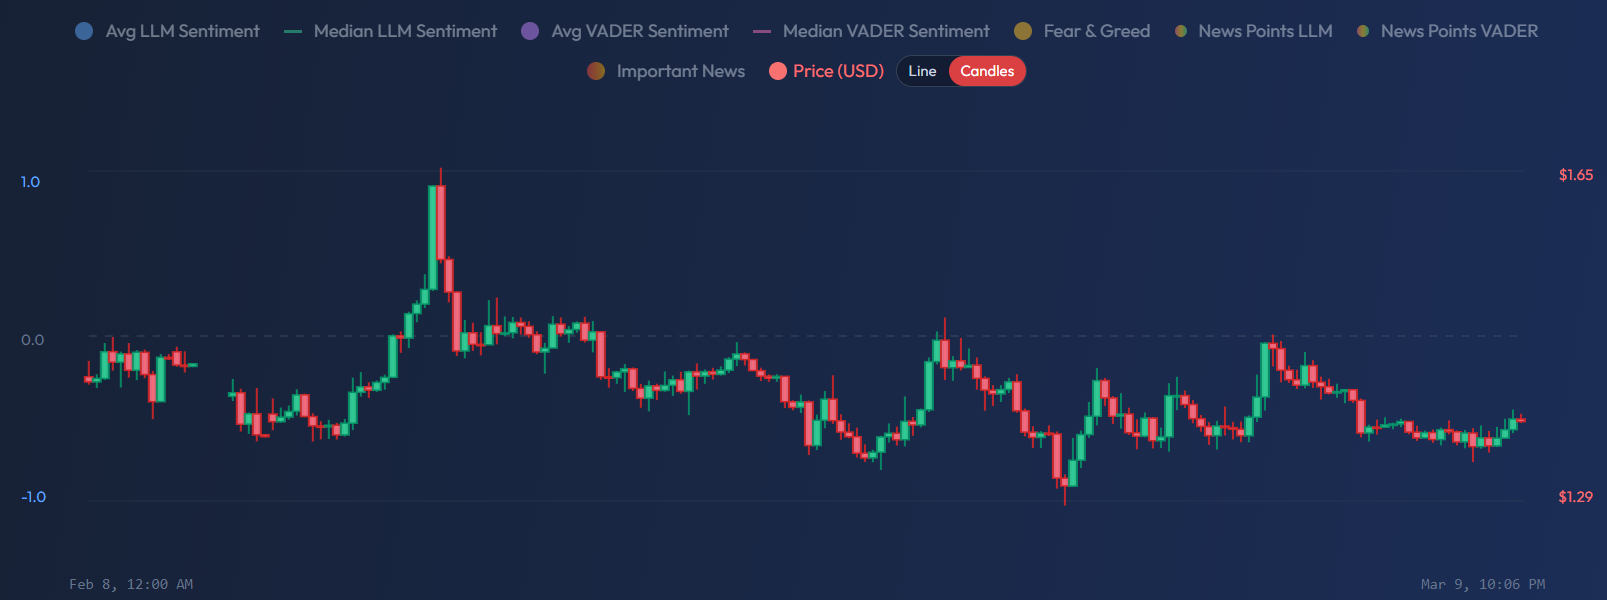
Line vs Candle Mode
Use the Candles button to switch the price display from a line chart to traditional candlesticks. This is useful when you want to see open/high/low/close price action alongside sentiment.
Daily Data Table
Below the chart, a table breaks down each day with exact numbers: Price, LLM Sentiment score, VADER Sentiment score, News Count, and Fear & Greed index.
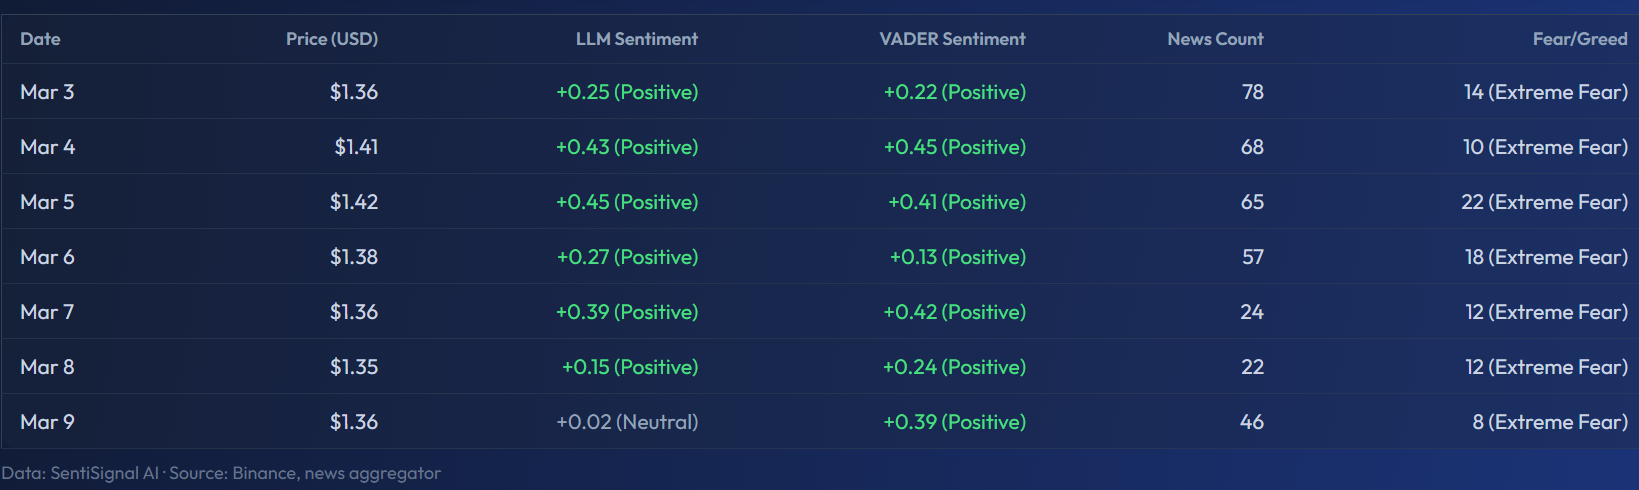
This table is useful for tracking how sentiment trended day-by-day and cross-referencing with specific market events.
Try It Live
Here is the live XRP chart — try toggling different sentiment layers using the legend: