Fear & Greed Index on the Chart
Understand the amber Fear & Greed overlay on crypto charts — what the levels mean and how to spot divergences with sentiment.

What Is the Fear & Greed Overlay?
On crypto asset charts, SentiSignal overlays the Crypto Fear & Greed Index as an amber line (#f59e0b). This indicator measures the overall emotional temperature of the crypto market on a scale from 0 to 100, with daily updates.
Important: The Fear & Greed Index is a crypto-only indicator. It will not appear on commodity or forex charts because it specifically measures crypto market crowd sentiment.
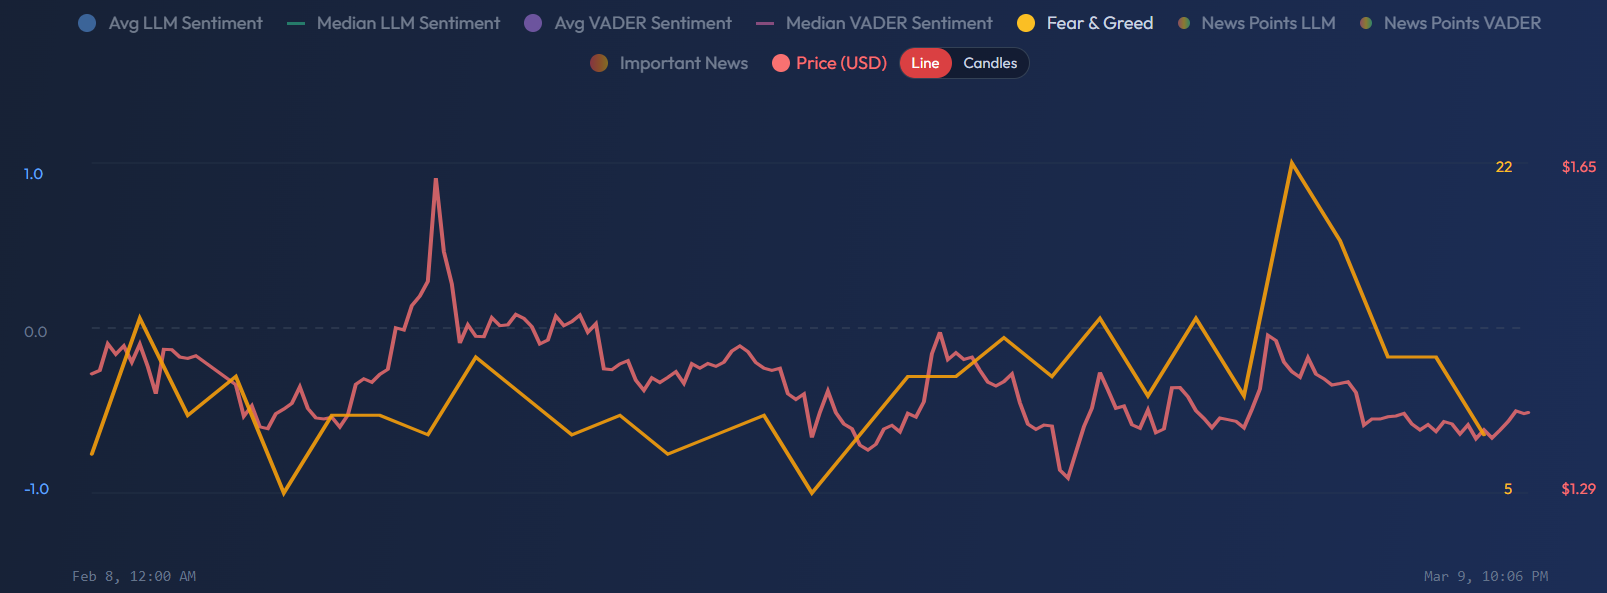
In the screenshot above you can see the XRP chart (Feb 8 – Mar 9) with the Fear & Greed series toggled on (highlighted in the legend). The orange/amber line oscillates between low values near 5 and higher values around 22 — all in the "Extreme Fear" zone. The price line (red/pink) shows XRP between $1.29 and $1.65. Notice how the F&G line and the price line sometimes move in the same direction — and sometimes diverge, which creates analytical opportunities.
The Scale
The Fear & Greed Index is displayed on a separate Y-axis (0-100) to avoid confusion with the sentiment scale (-1.0 to +1.0). The five zones are:
- 0–24: Extreme Fear (red) — The market is gripped by panic. Historically, extreme fear has been associated with market bottoms and capitulation events — heavy selling by participants who can no longer tolerate the pain.
- 25–44: Fear (orange) — Sentiment is negative but not at panic levels. Some opportunities may be forming as pessimism overshoots fundamentals.
- 45–55: Neutral (amber) — Balanced sentiment. No strong directional signal — the crowd is neither panicking nor euphoric.
- 56–75: Greed (green) — Market optimism is elevated. Prices may be extended. Watch for signs that the rally is becoming overheated.
- 76–100: Extreme Greed (dark green) — Euphoria. Everyone is bullish, prices are surging, and risk of a correction is high. Historically, extreme greed often precedes pullbacks.
The Contrarian Principle
Warren Buffett's famous advice applies directly here: "Be fearful when others are greedy, and greedy when others are fearful."
When the Fear & Greed Index hits extreme levels, it often signals that the market has overreacted in one direction. Extreme fear may represent a buying opportunity if you believe the fundamentals are sound. Extreme greed may signal it is time to reduce exposure or take profits.
Of course, this is not a timing tool — extremes can persist for days or weeks. Use it as context, not as a sole trigger.
Reading Divergences
The most interesting insight comes from comparing the Fear & Greed line with the LLM sentiment lines:
- F&G rising + Sentiment falling: The crowd is optimistic (greedy) but the actual news flow is turning negative. This mismatch could foreshadow a correction.
- F&G falling + Sentiment rising: The crowd is fearful but news is actually improving. This could signal an opportunity — the market may be lagging the news.
- Both aligned: When Fear & Greed and sentiment move in the same direction, the signal is reinforced. Bullish sentiment + greed = strong uptrend narrative. Bearish sentiment + fear = strong downtrend narrative.
Where Else Fear & Greed Appears
Beyond the chart overlay, the Fear & Greed value appears in:
- The Daily Data Table below the chart, with its classification label
- AI chart analysis reports, which reference the current F&G level when generating insights
- The Fear & Greed Index — What the Levels Mean lesson for a deeper standalone breakdown
The Fear & Greed overlay is most useful as a context layer. It does not tell you what the news says (that is what sentiment lines do) — it tells you how the crowd feels right now. Combine both for a more complete picture.