How to Embed a SentiSignal Chart on Your Website
Generate an iframe embed code for any SentiSignal chart and add live sentiment data to your blog, newsletter, or trading dashboard.

Embed Any Chart in Seconds
SentiSignal charts can be embedded on external websites using a simple iframe. Whether you run a trading blog, a crypto newsletter, or a research dashboard, you can add live, interactive sentiment charts to your pages.
How to Generate the Embed Code
- Navigate to any asset page (e.g. Bitcoin, Gold).
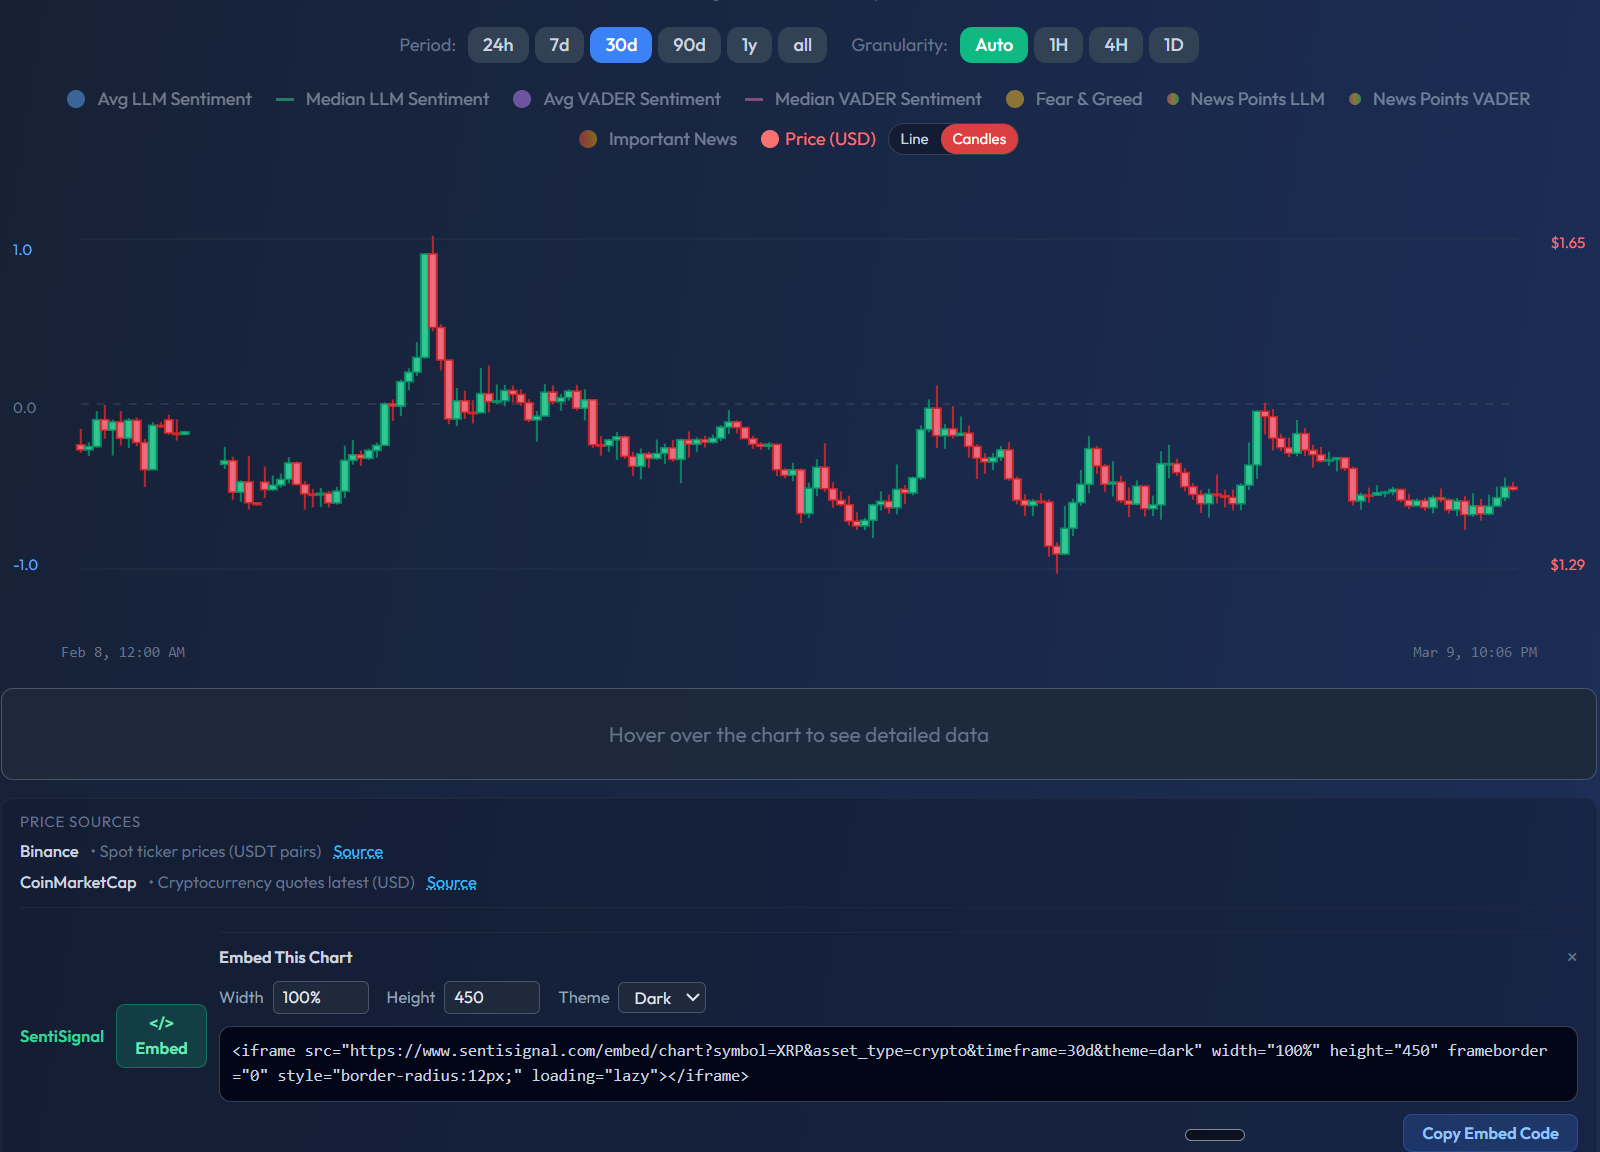
- Click the "Embed This Chart" button located near the chart controls.
- A panel will appear with the generated iframe HTML code, ready to copy.
Embed Parameters
The embed URL accepts the following parameters:
- symbol — The asset symbol (e.g. BTC, ETH, GOLD, EURUSD)
- asset_type — The asset class:
crypto,commodity, orfx - timeframe — The default period shown:
24h,7d,30d,90d,1y,All - theme — Visual theme:
darkorlight
Example Code
Here is an example embedding a 7-day Bitcoin chart with the dark theme:
<iframe
  src="https://sentisignal.com/embed/chart?symbol=BTC&asset_type=crypto&timeframe=7d&theme=dark"
  width="100%"
  height="450"
  frameborder="0"
></iframe>
And a Gold commodity chart with a 30-day view:
<iframe
  src="https://sentisignal.com/embed/chart?symbol=GOLD&asset_type=commodity&timeframe=30d&theme=dark"
  width="100%"
  height="450"
  frameborder="0"
></iframe>
What the Embed Includes
The embedded chart is fully interactive — your visitors can:
- Switch between timeframes using the period selector
- Adjust granularity (Auto, 1H, 4H, 1D)
- Toggle all sentiment series (LLM, VADER, Fear & Greed, News Points)
- Hover over data points for detailed tooltips
- Switch between line and candlestick modes
It is the same chart experience as on the main SentiSignal site, rendered within your page.
Technical Details
Security
The embed pages have frame-ancestors configured to allow embedding on external domains. Embed pages are set to noindex so they will not compete with the main site in search results.
Caching
Embedded charts use a 5-minute edge cache on the CDN. This means your embedded chart will update with fresh sentiment data approximately every 5 minutes, balancing real-time responsiveness with performance.
Responsive Design
Set width="100%" for responsive behavior — the chart will adapt to the container width. A height of 450px is recommended for a good viewing experience, but you can adjust it to fit your layout.
Use Cases
- Trading blogs: Embed relevant charts alongside your written analysis
- Newsletters: Link to or embed live charts so readers get up-to-the-minute sentiment data
- Research dashboards: Build internal tools with multiple SentiSignal embeds for different assets
- Social media: Share the embed URL directly — the page renders a full standalone chart
For questions about the data series shown in embedded charts, refer to Chart Legend: LLM vs VADER, Average vs Median.