Daily Data Table — Day-by-Day Breakdown
A structured table below the chart showing exact daily values for price, sentiment, news count, and Fear & Greed.

What Is the Daily Data Table?
Located directly below the sentiment chart, the Daily Data Table provides a structured, row-by-row breakdown of key metrics for each day. By default, it displays the last 7 days of data.
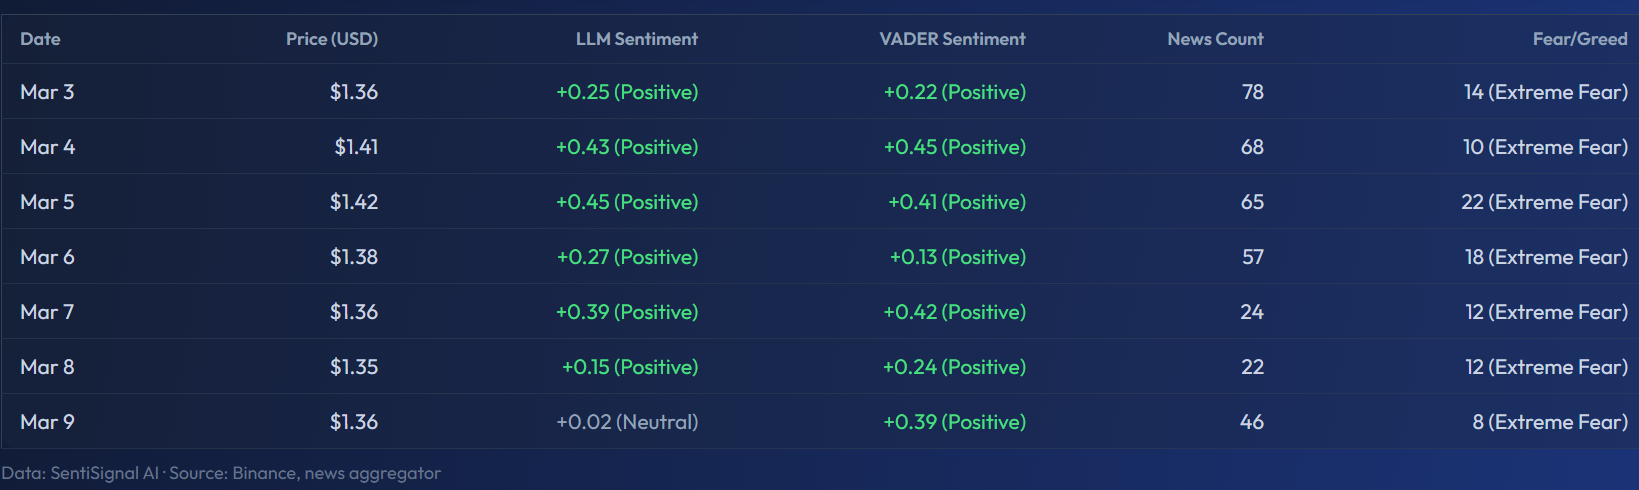
The screenshot shows the XRP data table for March 3–9. You can see each day's price (ranging from $1.35 to $1.42), LLM Sentiment values like +0.25 to +0.45 labeled "(Positive)", VADER Sentiment with similar positive labels, News Count (24 to 78 articles per day), and the Fear/Greed column showing consistently low values (8–22) marked as "(Extreme Fear)". The bottom row states the data source: "SentiSignal AI · Source: Binance, news aggregator."
Table Columns
Each row represents one day and includes the following columns:
Date
The calendar date for that row's data.
Price (USD)
The daily average price in US dollars. This is computed from all price data points within the day, giving you a representative value rather than just the close.
LLM Sentiment
The average LLM sentiment score for the day, accompanied by a classification label:
- Positive — Score above +0.2
- Neutral — Score between -0.2 and +0.2
- Negative — Score below -0.2
The label provides a quick visual cue so you do not need to interpret raw numbers for every row.
VADER Sentiment
The average VADER sentiment score for the day. Comparing the LLM and VADER columns side-by-side can reveal when the two engines disagree — a useful signal as discussed in What Is VADER and How It Differs from LLM.
News Count
The total number of analyzed articles for that asset on that day. A sudden spike in news count often accompanies major events — regulatory announcements, partnerships, market crashes — and can explain sentiment shifts.
Fear / Greed
The Crypto Fear & Greed Index value for that day, with its classification (Extreme Fear, Fear, Neutral, Greed, or Extreme Greed). This column only appears for crypto assets. Learn more in Fear & Greed Index — What the Levels Mean.
How to Use the Table
Track Day-by-Day Shifts
Scan the LLM Sentiment column from top to bottom. A gradual shift from Positive → Neutral → Negative over several days tells a different story than a sudden one-day plunge. The table makes these trends immediately visible.
Cross-Reference with Market Events
If you know something significant happened on a specific date — a central bank decision, an exchange hack, a major partnership announcement — find that row in the table. Check whether the sentiment score, news count, and Fear & Greed levels reflect what you expected. If sentiment stayed neutral despite a seemingly major event, the market may have already priced it in.
Spot Divergences
Compare the LLM and VADER columns. If LLM says +0.4 (Positive) but VADER says -0.1 (Neutral), the full-text AI analysis found positive signals that simple lexicon analysis missed. This is common with nuanced articles that contain negative vocabulary but positive conclusions.
SEO and AI Indexing
The Daily Data Table also serves a technical purpose: it provides structured data that search engines and AI agents can parse. This means SentiSignal's daily sentiment values can appear in search results and be referenced by AI assistants, increasing the visibility and discoverability of sentiment data for each tracked asset.
For the full picture, combine the data table with the interactive sentiment chart above it — the chart shows the shape of the trend, while the table gives you the exact numbers.