What Is SentiLab and What It's For
SentiSignal's data science experimentation platform — quantify the relationship between news sentiment and price.

SentiLab: Your Quantitative Research Platform
SentiLab is SentiSignal's built-in data science experimentation platform. While the main asset pages give you charts and analytical tools, SentiLab lets you go deeper — running statistical analyses that quantify the relationship between news sentiment and price movements.
It transforms SentiSignal from a sentiment dashboard into a quantitative research tool.
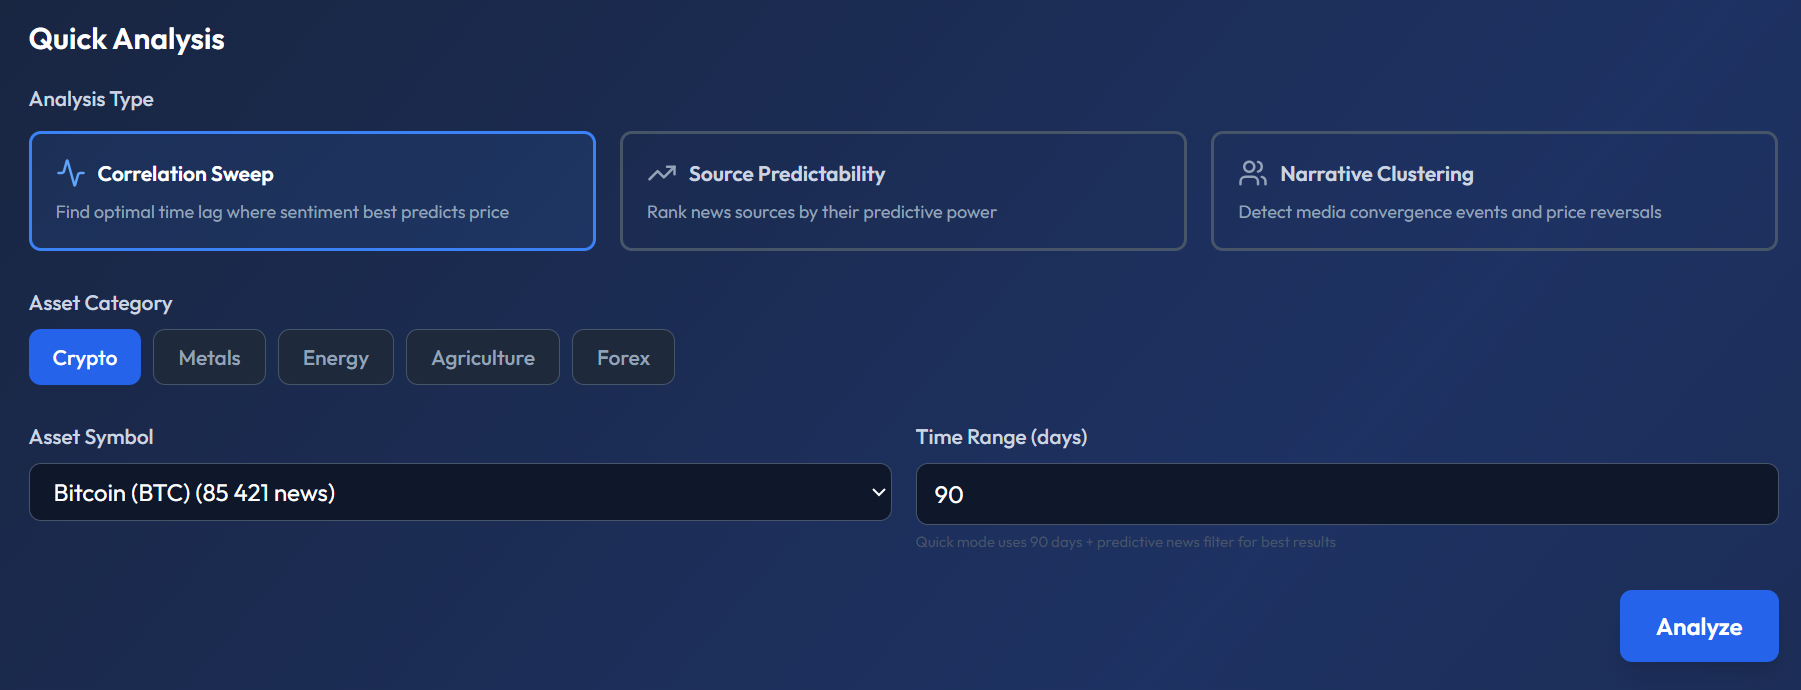
The screenshot shows the Quick Analysis panel. At the top, three cards let you choose the Analysis Type: Correlation Sweep (highlighted with blue border), Source Predictability, and Narrative Clustering — each with a short description. Below that: Asset Category buttons (Crypto, Metals, Energy, Agriculture, Forex), an Asset Symbol dropdown showing "Bitcoin (BTC) (85 421 news)", a Time Range (days) field set to 90, and a blue "Analyze" button. A hint below reads: "Quick mode uses 90 days + predictive news filter for best results."
Three Analysis Types
SentiLab offers three distinct analysis methods, each answering a different question:
1. Correlation Sweep
Finds the optimal time lag where sentiment best predicts price. Uses Cross-Correlation Function (CCF) with False Discovery Rate (FDR) correction for statistical rigor. Answers: "Does sentiment lead price for this asset, and by how many hours?"
Detailed lesson: Understanding Correlation Sweep
2. Source Predictability
Ranks news sources by their predictive power. For each source, it tests whether their articles tend to lead or lag price movements. Answers: "Which news sources should I follow most closely for early signals?"
Detailed lesson: Source Predictability Analysis
3. Narrative Clustering
Detects media convergence events — moments when many sources suddenly report on the same topic simultaneously — and analyzes their impact on price. Answers: "Does herd media behavior create contrarian trading opportunities?"
Detailed lesson: Narrative Clustering Analysis
Getting Started: Quick Analysis
Access SentiLab at /lab (requires a free account). The Quick Analysis mode gets you started in seconds:
- Select your analysis type (Correlation Sweep, Source Predictability, or Narrative Clustering).
- Choose your asset (e.g., Bitcoin, Gold, EUR/USD).
- Set a time range (e.g., last 90 days).
- Click Analyze.
Results appear within a few seconds, displaying charts, tables, and interpretation text.
Advanced Configuration
For more refined analyses, expand the Advanced Configuration panel. This gives you access to:
- Quality filters — minimum article quality score (0–1).
- Credibility filters — minimum source credibility score (0–1).
- Lag range — how many hours forward/backward to test (Standard ±24h, Extended ±72h, Weekly ±168h).
- Keywords — filter to articles containing specific terms.
- Intent type — filter by article intent (future_oriented, past_oriented, etc.).
These filters are covered in depth in the Advanced Filters lesson.
Saving and Publishing Experiments
Every analysis can be saved as an experiment — storing both the configuration and results for later reference. You can return to a saved experiment to review its findings or re-run it with updated data.
You can also publish an experiment to share it publicly on the /experiments page. Published experiments go through a quality gate: the system evaluates the experiment using an LLM and assigns a score out of 100. Only experiments scoring ≥ 60/100 can be published. This ensures the public experiment feed maintains a baseline quality standard.
Why This Matters
Most crypto sentiment tools stop at "here's the sentiment, here's the price." SentiLab goes further by letting you quantify whether sentiment actually matters for a specific asset, which sources are predictive, and whether media herd behavior creates exploitable patterns. It's the difference between looking at a chart and doing data science on it.