Advanced Filters: Quality, Credibility, and Importance
Fine-tune your SentiLab experiments by filtering for the highest-quality, most credible, and most impactful news.

Why Filters Matter
Every SentiLab experiment operates on a dataset of news articles. The quality of your results depends directly on the quality of that input data. Advanced filters let you control which articles are included in the analysis, trading off between signal cleanliness and dataset size.
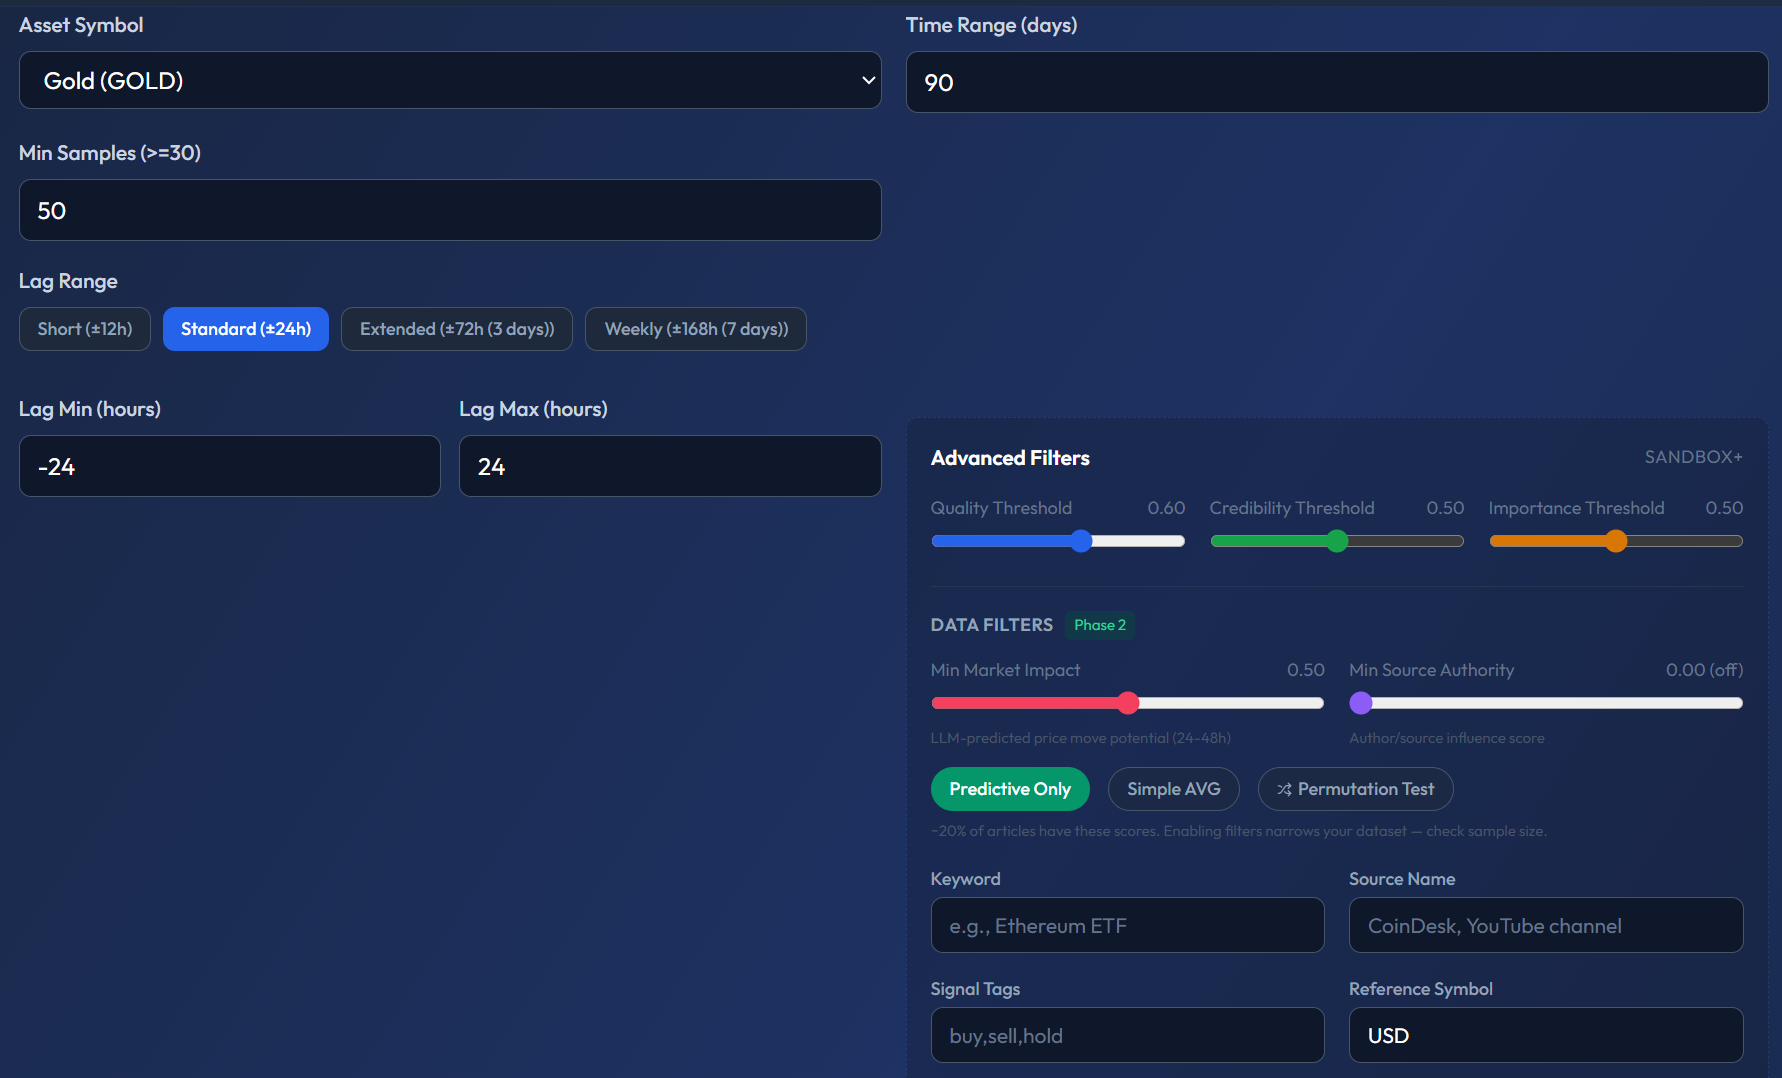
The advanced panel (shown for Gold, 90 days) has two sections. Left side: Asset Symbol dropdown, Time Range, Min Samples (50), and Lag Range with preset buttons (Short ±12h, Standard ±24h, Extended ±72h, Weekly ±168h) plus custom Lag Min/Max fields. Right side: Advanced Filters with sliders for Quality Threshold, Credibility Threshold, and Min Market Impact (Phase 2 label). Below that: DATA FILTERS with toggles for Predictive Only (highlighted green), Simple AVG, and Permutation Test. Then text fields: Keyword, Source Name, Signal Tags, and Reference Symbol (USD).
Available Filters
Min Quality Score (0–1, default: 0.7)
Filters articles by how well-written and substantive they are. The quality score is assigned by the LLM during deep analysis and considers factors like:
- Article length and depth of analysis.
- Presence of data, sources, and evidence.
- Writing quality and coherence.
Default 0.7 already excludes most low-quality content. Raising to 0.9 eliminates approximately 60% of articles but ensures only the highest-quality journalism remains. This is useful when you want your analysis to reflect institutional-grade reporting only.
Min Credibility Score (0–1, default: 0)
Filters by the publishing source's credibility. Credibility is assessed based on the source's track record, editorial standards, and reputation.
- 0 (default) — includes all sources, no credibility filter.
- 0.7+ — includes only established, reputable sources (major financial publications, wire services).
- 0.9+ — extremely strict, only the most trusted sources.
Min Importance Score (0–1)
Filters by the article's market-moving potential. Importance reflects how significant the event is to the market.
- 0 — includes everything, even routine market updates.
- 0.5+ — focuses on significant events only (regulatory decisions, major partnerships, protocol upgrades).
- 0.8+ — only the most consequential events (SEC rulings, exchange failures, major protocol forks).
Influence Score (0–1)
Filters by the market influence of the author, subject, or quoted entity. This score reflects who is speaking:
- 1.0 — the most influential figures: Jerome Powell, Vitalik Buterin, SEC Chair, head of major central banks.
- 0.7+ — institutional or expert level: CEOs of major exchanges, prominent fund managers, senior regulators.
- 0.3–0.7 — mid-tier influencers: industry analysts, mid-size project founders, financial journalists.
Market Impact Score (0–1)
The LLM's predicted probability that a specific article will affect price. Unlike importance (which measures event significance), market impact measures the likelihood of price reaction:
- 0.5+ — only articles the LLM believes have a greater-than-even chance of moving price.
- 0.8+ — only articles where price impact is highly probable.
The Quality–Quantity Trade-off
Every filter you tighten reduces your dataset size. This creates a fundamental trade-off:
- Stricter filters = cleaner signal, less noise, but fewer data points → potentially less statistically reliable results (wider confidence intervals, higher p-values).
- Looser filters = more data points, better statistical power, but more noise → signal may be diluted by low-quality content.
There is no universally "correct" setting. The optimal filters depend on your asset, time range, and the specific question you're investigating.
Recommended Approach
- Start with defaults — quality 0.7, credibility 0, no importance or influence filters.
- Review the results — if the correlation is weak or the signal is noisy, tighten filters incrementally.
- Compare configurations — run the same analysis twice: once with default filters, once with strict filters. If the signal gets stronger with tighter filters, the noise was hurting you. If it gets weaker or disappears, you may have filtered out too much data.
Save both configurations as experiments so you can compare them side-by-side later.
Which Filters Apply to Which Analyses
All filters work across all three SentiLab analysis types:
- Correlation Sweep — filters which articles contribute to the hourly sentiment averages.
- Source Predictability — filters which articles are attributed to each source.
- Narrative Clustering — filters which articles are counted in convergence detection.
Why This Matters
Garbage in, garbage out. The difference between a noisy, unreliable analysis and a clean, actionable signal often comes down to data quality. Advanced filters give you control over that quality, letting you tune the input data to match your research standards and risk tolerance.