Understanding Correlation Sweep in SentiLab
Find the optimal time lag where news sentiment best predicts price movement for any asset.

What is Correlation Sweep?
Correlation Sweep is SentiLab's most powerful analysis tool. It tests whether news sentiment leads, lags, or moves in sync with price — and if it leads, by how many hours.
For example, if sentiment for a specific asset shows a strong correlation at +24h lag, it means: "on average, when sentiment is high today, price tends to be higher 24 hours later." That is a potentially predictive signal.
Running a Quick Analysis
Go to SentiLab and choose Correlation Sweep:
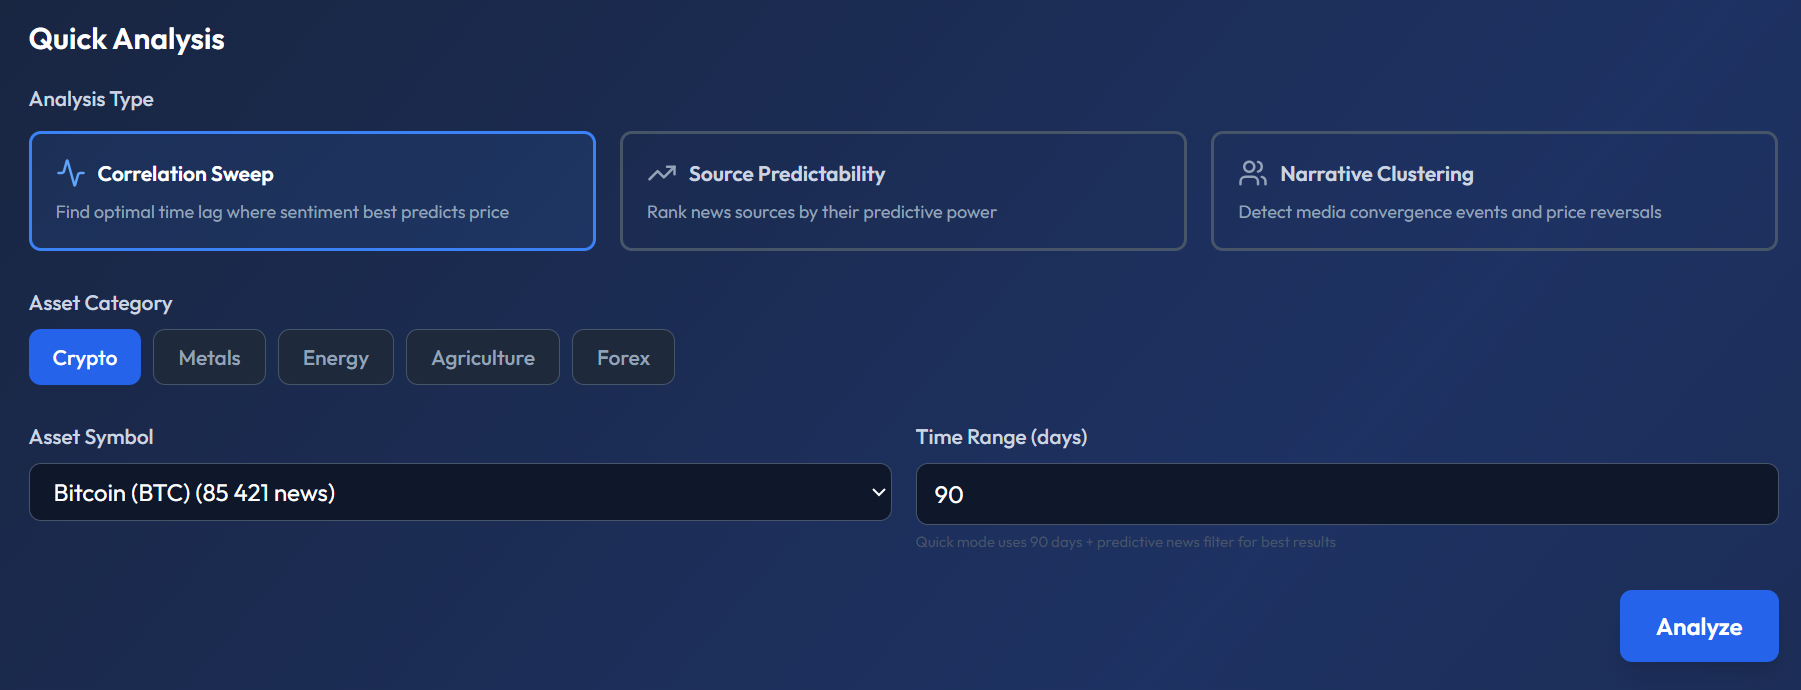
- Select Analysis Type: Correlation Sweep
- Choose Asset Category: Crypto, Metals, Energy, Agriculture, or Forex
- Select your Asset Symbol (e.g. Bitcoin — BTC)
- Set Time Range: 90 days is recommended for statistical reliability
- Click Analyze
Reading the Results
After the analysis completes, you will see a results panel:
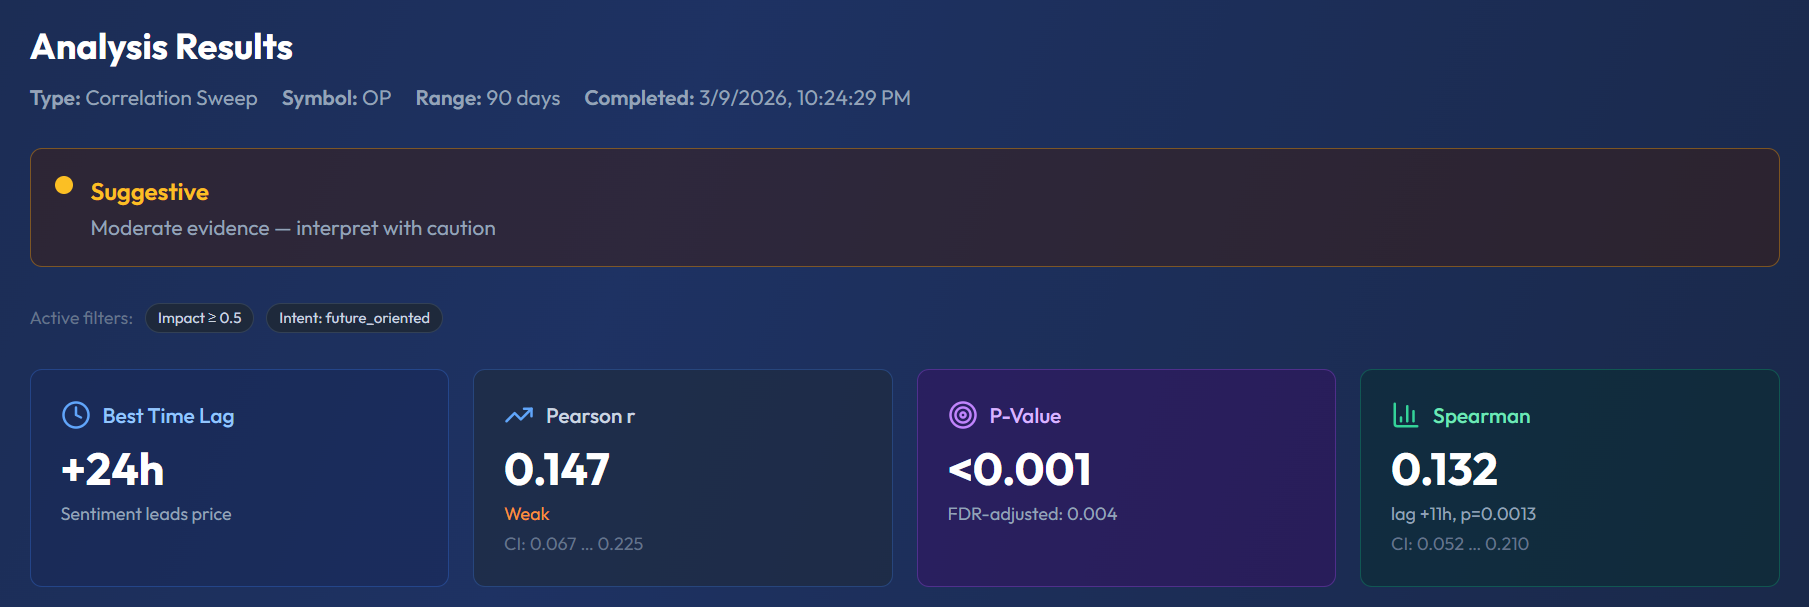
The key metrics to understand:
Best Time Lag
The lag (in hours) where sentiment shows the strongest correlation with price. A positive lag (e.g. +24h) means sentiment leads price. A negative lag means price leads sentiment (media is reacting).
Pearson r (Correlation Coefficient)
Ranges from -1 to +1:
- 0.0–0.1: No meaningful correlation
- 0.1–0.3: Weak — suggestive, interpret with caution
- 0.3–0.5: Moderate — worth incorporating into analysis
- 0.5+: Strong — statistically significant signal
P-Value
Statistical significance. P < 0.05 means the result is unlikely to be due to random chance. The system also shows the FDR-adjusted p-value, which corrects for testing multiple lags simultaneously.
Confidence Level
The results include a confidence badge:
- Suggestive — moderate evidence, interpret with caution
- Moderate — reasonable signal, consider alongside other factors
- Strong — high statistical confidence
Top Deviations Table
The table shows the top lags ranked by correlation strength. Use this to identify whether the strongest signal is concentrated around one specific time window or spread across multiple lags.
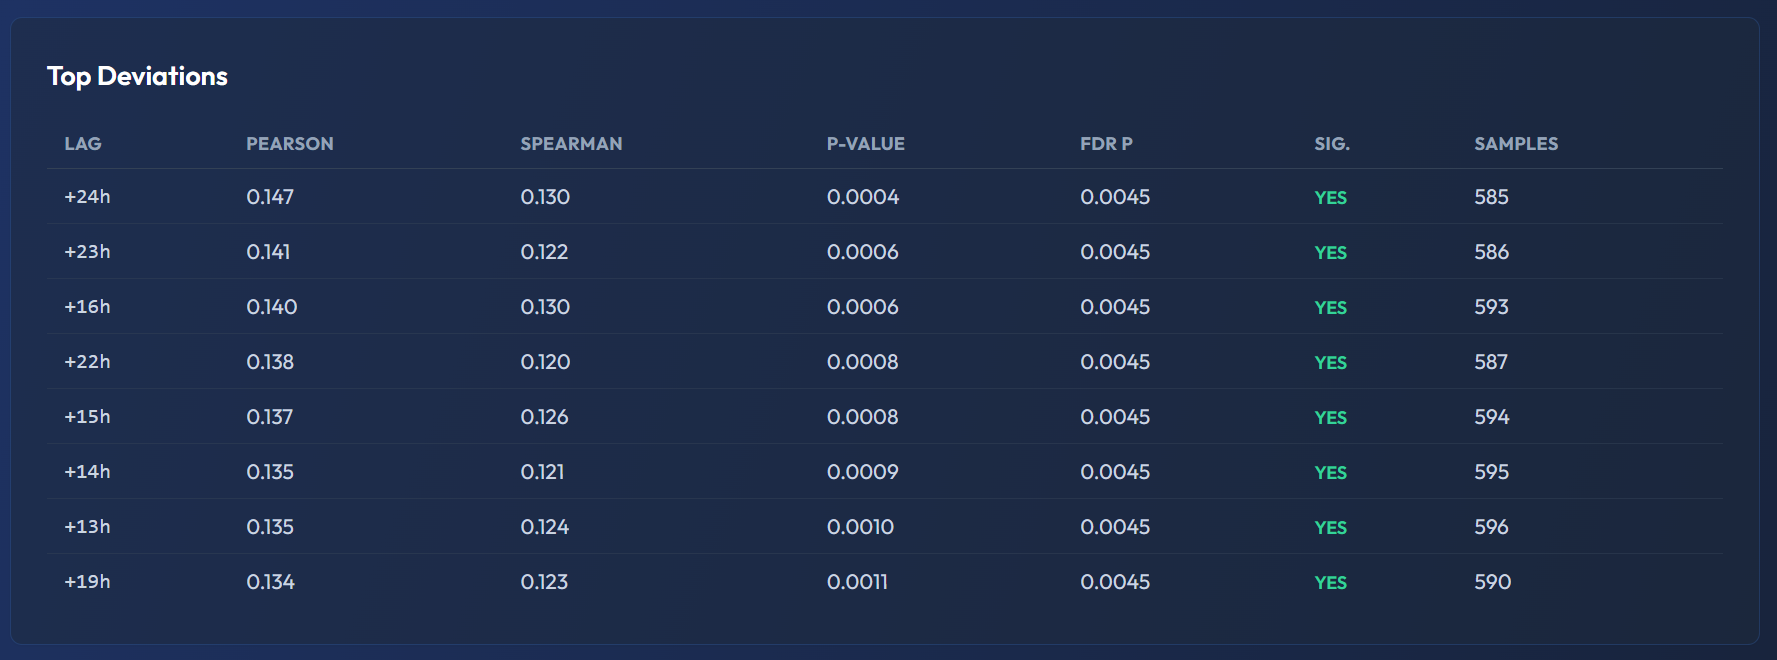
The green YES in the SIG column confirms the lag survived FDR correction — the correlation is not just a statistical artifact.
Advanced Filters
For more refined results, switch to the advanced configuration:
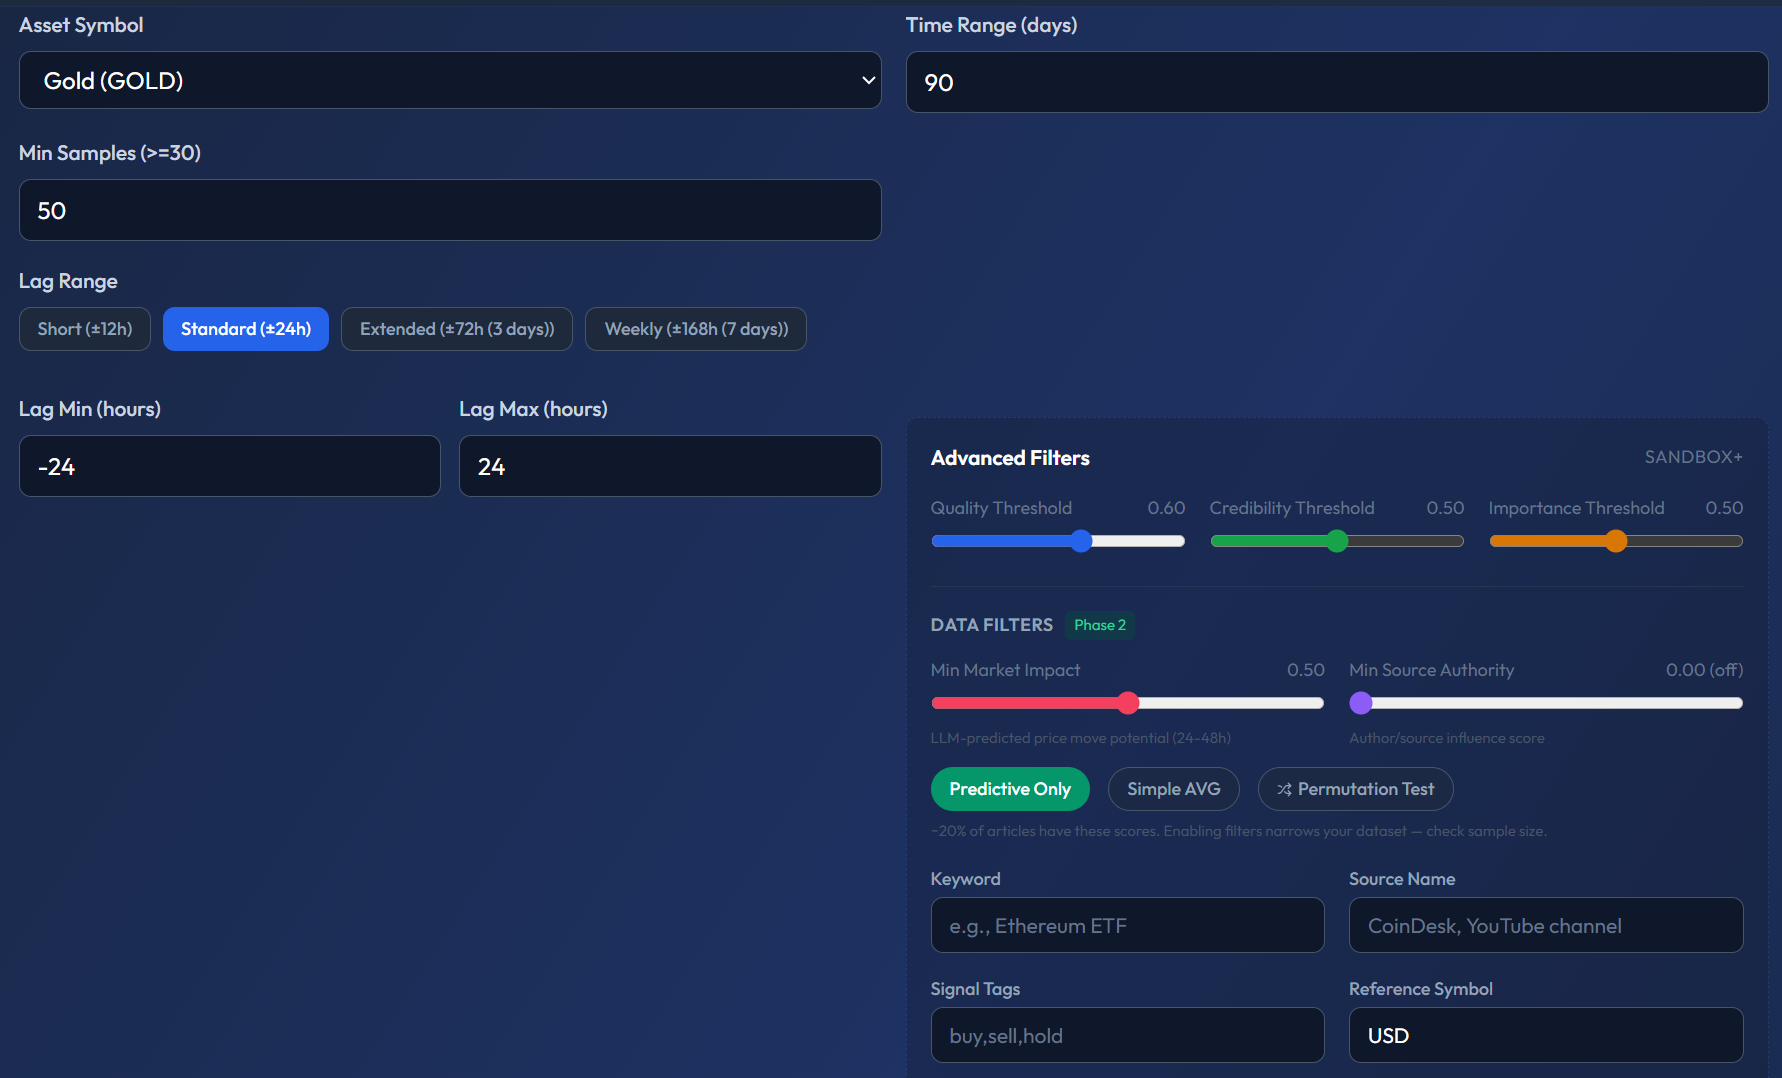
- Min Quality Score — filter out low-quality news sources
- Predictive Only — only include articles the AI classified as forward-looking
- Lag Range — Standard (±24h), Extended (±72h), or Weekly (±7 days)
- Signal Tags — filter by tagged news signals (e.g. "buy, sell, hold")
Practical Takeaway
Correlation Sweep alone should not be your only trading signal — but it helps you understand whether sentiment data is useful for a particular asset and at what time window. Combine it with Source Predictability to find which specific news sources are the most forward-looking.