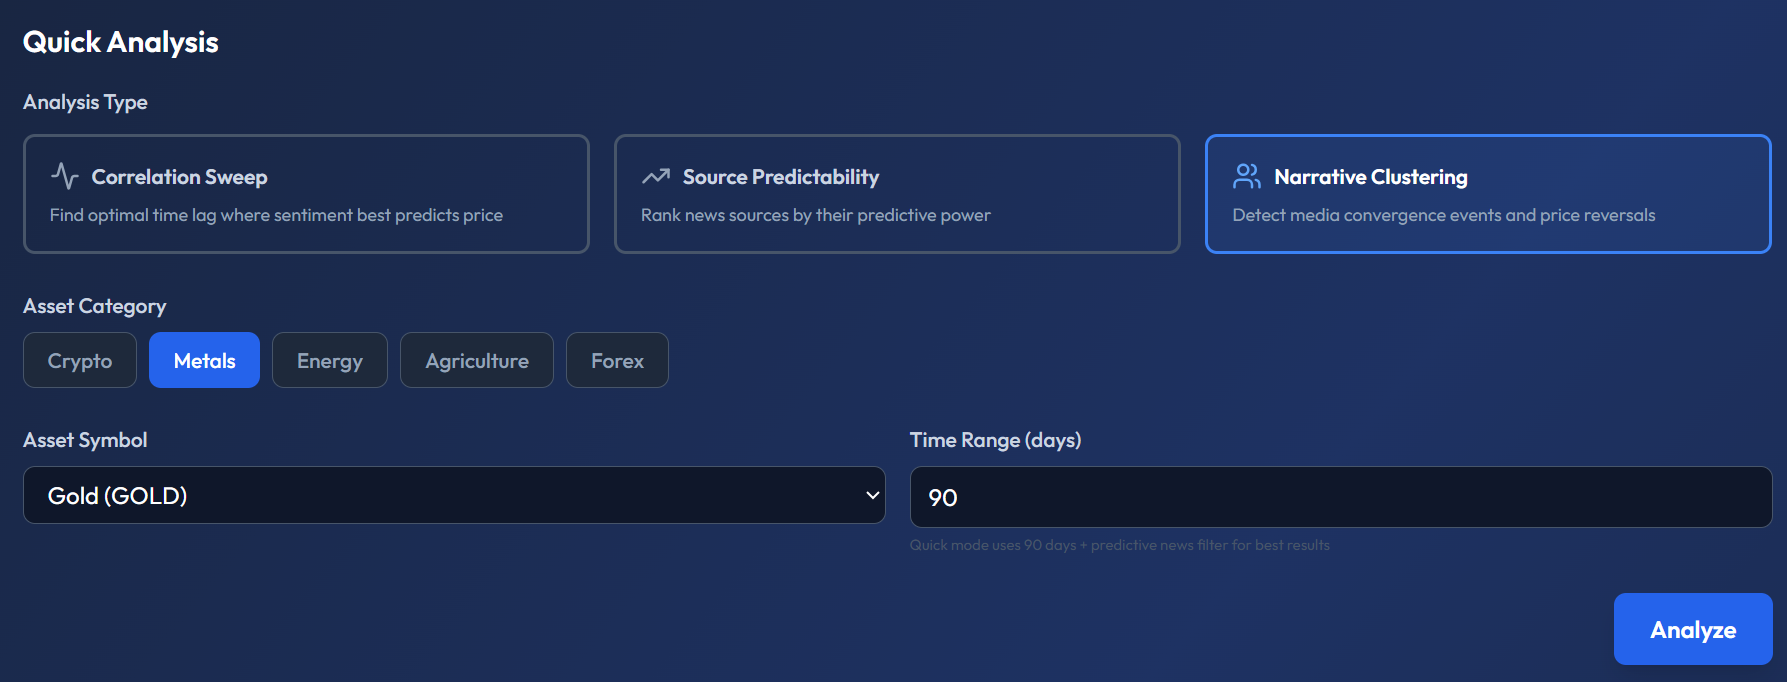
Narrative Clustering — Detecting Media Convergence
Detect when many sources suddenly report on the same topic and analyze whether media herd behavior creates contrarian opportunities.

What Is Narrative Clustering?
Narrative Clustering is the third analysis type in SentiLab. It detects media convergence events — moments when an unusually high number of news sources suddenly report on the same topic at the same time — and measures their impact on price.
The core hypothesis: when media herds around a narrative, the resulting price move is often already priced in, creating contrarian opportunities.
How the Algorithm Works
The algorithm follows a multi-step process:
- Group news by hour — counts how many distinct sources published in each hourly window.
- Calculate z-scores — compares each hour's source count against the baseline average. A z-score ≥ 1.0 indicates significantly more sources than normal.
- Merge adjacent hours — consecutive hours with elevated z-scores are merged into a single cluster (allowing a gap of ≤ 2 hours between spikes).
- Measure price impact — calculates the price change ±4 hours around the cluster's peak activity.
What Defines a Convergence Event
A convergence event triggers when the z-score ≥ 1.0, meaning the number of sources publishing in that window is significantly higher than the baseline. For example, if the average hour sees 2.1 sources publishing and a particular hour sees 8 sources, that's a strong convergence event.
Output Per Cluster
Each detected cluster includes rich metadata:
- Timestamp — when the convergence peaked.
- Source Count — how many distinct sources participated.
- Article Count — total articles in the cluster.
- Sources List — which specific publishers contributed.
- Average Sentiment — the mean sentiment across all clustered articles.
- Duration (hours) — how long the convergence event lasted.
- Z-Score — how far above baseline this cluster is.
- Trend Before (% price change) — price movement leading into the cluster.
- Trend After (% price change) — price movement following the cluster.
- Reversal Boolean — did price reverse direction after the cluster?
- Signal Type — classification of the cluster's market meaning.
Signal Types
Each cluster is classified into one of five signal types:
- sell_the_news — a bullish cluster (positive sentiment) followed by a price drop. The good news was already priced in.
- buy_the_dip — a bearish cluster (negative sentiment) followed by a price rise. The panic was overdone.
- momentum_bullish — a bullish cluster followed by continued price increase. The trend has legs.
- momentum_bearish — a bearish cluster followed by continued price decline. The downtrend persists.
- neutral — no clear directional signal from the cluster.
Key Metrics
Two aggregate metrics summarize the overall findings:
Contrarian Accuracy
The percentage of strong-sentiment clusters that showed an opposite price move. If contrarian accuracy is above 50%, it means media convergence events have historically been better used as fade signals than follow signals for this asset.
Baseline Reversal Rate
The random reversal rate for comparison. If contrarian accuracy is significantly higher than the baseline, the media convergence effect is real and exploitable. If they're similar, reversals are just noise.
Example
Consider this detected cluster:
8 sources converge (vs 2.1 avg baseline), average sentiment +0.62, price before: -1.8%, price after: +3.2% → classified as "buy_the_dip" signal.
Translation: a large number of sources published simultaneously with bullish sentiment. Price had been falling beforehand but reversed upward afterward. The media convergence around positive narratives coincided with the price bottom.
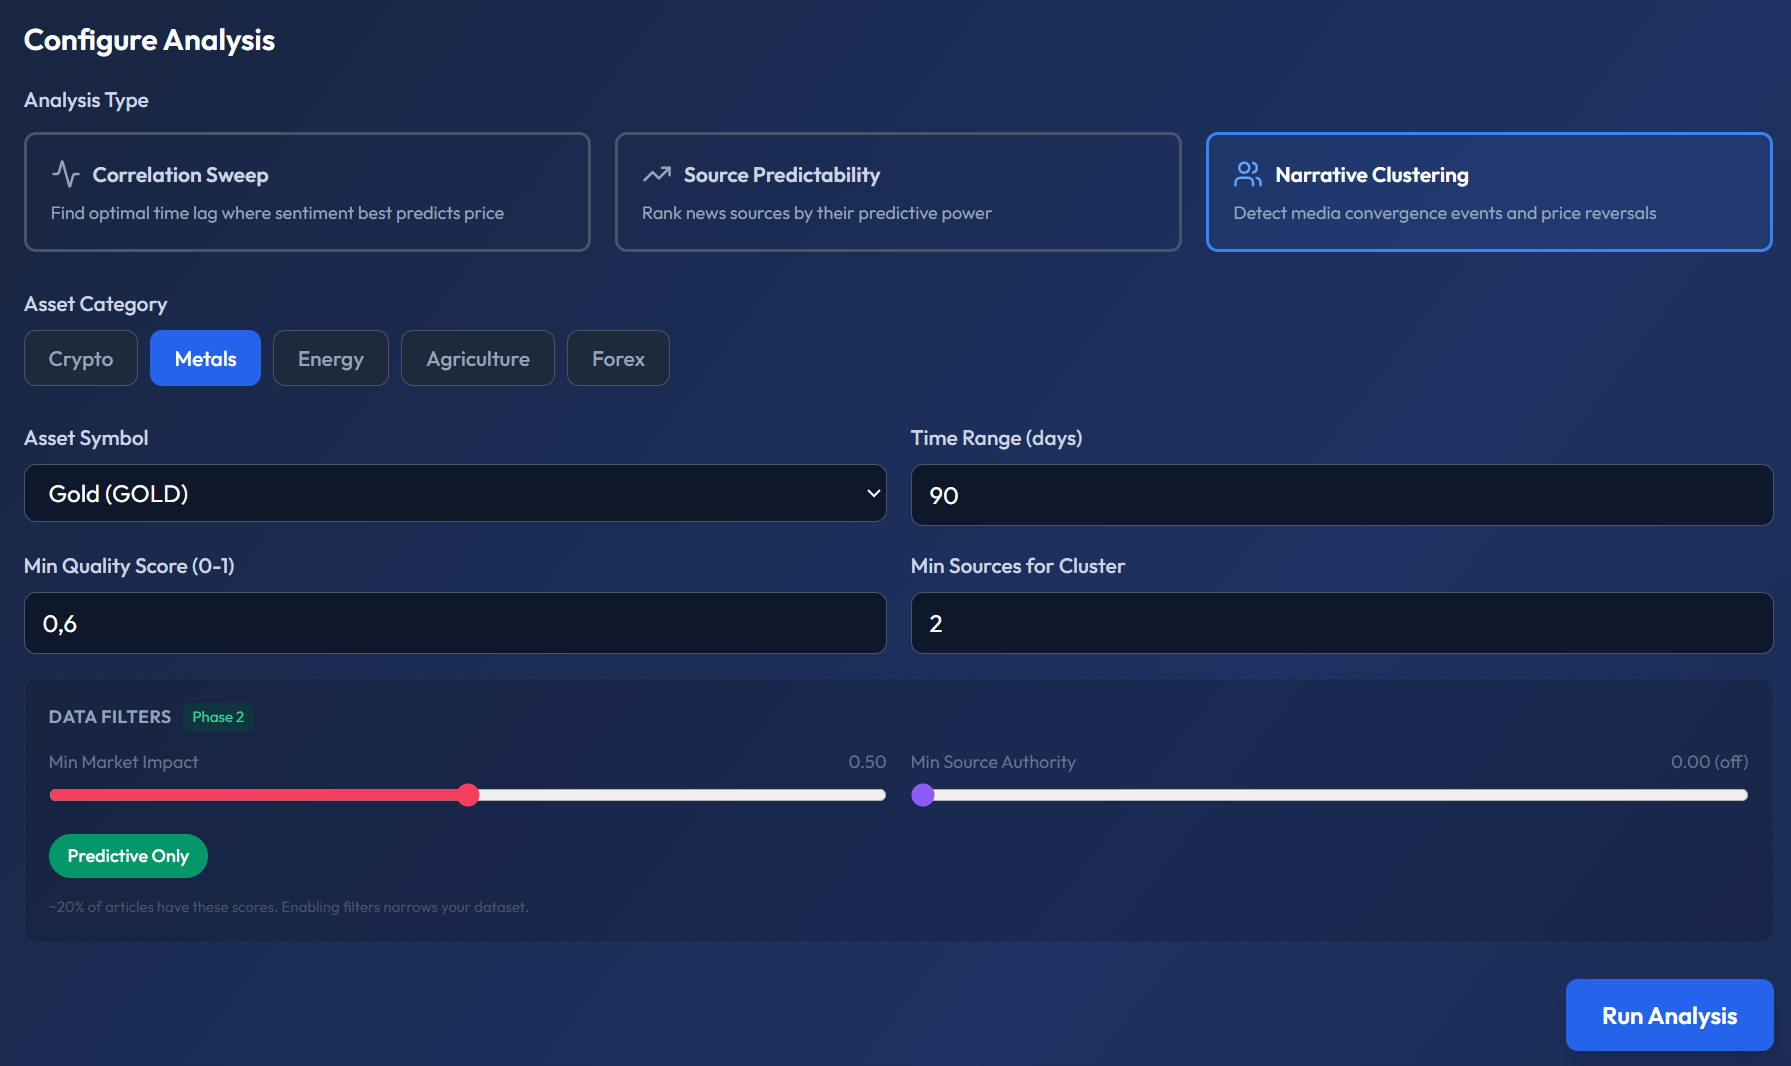
Configuration Parameters
- Min Sources — minimum number of distinct sources required to form a cluster (default: 3).
- Days Back — how far back to analyze.
- Quality / Credibility Filters — same as other SentiLab analyses (see Advanced Filters).
Practical Use
Narrative Clustering is most useful for identifying moments when everyone is talking about the same thing. In markets, extreme consensus often marks turning points. When every source is bullish, who's left to buy? When every source is bearish, who's left to sell?
Use contrarian accuracy to determine whether this pattern holds for the specific asset you're trading. If it does, media convergence events become actionable fade signals.
Why This Matters
Traditional sentiment analysis counts positive vs negative articles. Narrative Clustering goes further by detecting when multiple independent sources synchronize around the same story. This collective behavior is a fundamentally different signal — and historically, it has been one of the more reliable contrarian indicators in financial markets.