How to Read Correlation Sweep Results
Understand every metric in the Correlation Sweep results panel — from best lag and Pearson r to confidence intervals and reliability badges.

The Results Panel at a Glance
After running a Correlation Sweep in SentiLab, the results panel presents seven key metrics. Understanding each one is essential before you draw any conclusions about sentiment-price relationships.
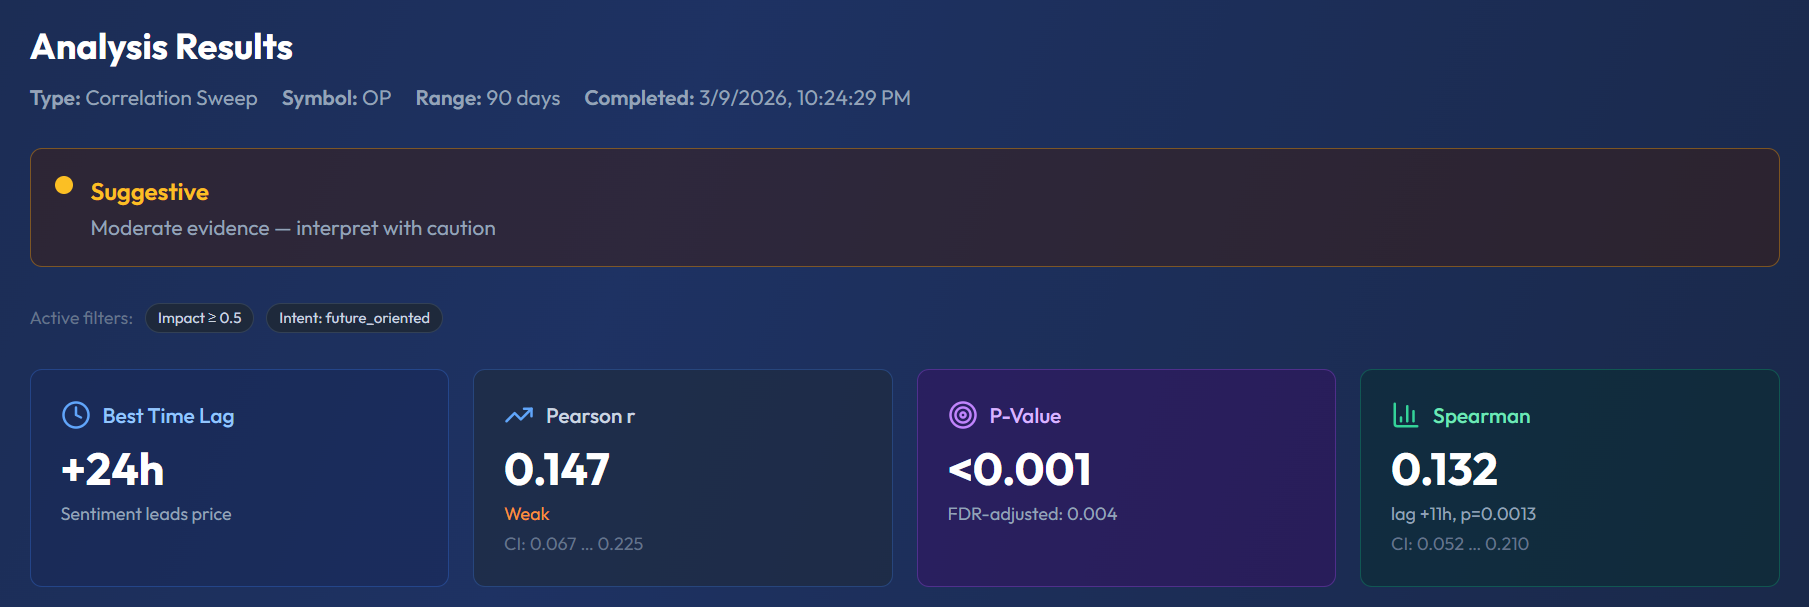
In this screenshot you can see results for OP (Optimism) over 90 days. At the top: the yellow "Suggestive" confidence badge with "Moderate evidence — interpret with caution." Active filters are shown as tags: Impact ≥ 0.5 and Intent: future_oriented. Then four metric cards: Best Time Lag +24h ("Sentiment leads price"), Pearson r 0.147 ("Weak", CI: 0.067…0.225), P-Value <0.001 (FDR-adjusted: 0.004), and Spearman 0.132 (lag +11h, p=0.0013, CI: 0.052…0.210). Notice that Pearson and Spearman have different best lags (+24h vs +11h) — this is common and we will explain why below.
Best Lag — Direction and Timing
The best lag tells you the time offset (in hours) at which sentiment and price show the strongest correlation:
- Positive lag (e.g., +12h): Sentiment leads price. This is the predictive scenario — sentiment today correlates with price movement hours later.
- Negative lag (e.g., -8h): Sentiment follows price. Media is reacting to price moves that already happened.
- Zero lag: Sentiment and price move simultaneously — synchronized but not predictive.
Positive lags are the most actionable for traders because they suggest a window in which sentiment data may forecast price direction.
Pearson r — Linear Correlation
The Pearson correlation coefficient ranges from -1 to +1 and measures the strength and direction of the linear relationship between sentiment and price:
- |r| > 0.5: Strong correlation
- |r| 0.3–0.5: Moderate correlation — worth incorporating into analysis
- |r| 0.1–0.3: Weak correlation — suggestive but not conclusive
- |r| < 0.1: No meaningful correlation
A positive r means sentiment and price move in the same direction (bullish sentiment → price increase). A negative r means they move inversely.
Spearman r — Rank-Based Correlation
Spearman r uses rank ordering rather than raw values, making it more robust to outliers and non-linear relationships. If Spearman r differs significantly from Pearson r, the relationship between sentiment and price is likely non-linear — for example, extreme sentiment shifts may have outsized effects on price while moderate shifts have little impact.
When both metrics agree closely, you can have greater confidence that the relationship is genuine and approximately linear.
95% Confidence Interval (Fisher z-Transform)
The confidence interval tells you the range within which the true correlation likely falls. SentiSignal computes this using the Fisher z-transform method:
- Narrow CI (e.g., [0.35, 0.40]): Precise estimate. You can be confident in the reported r value.
- Wide CI (e.g., [0.1, 0.5]): Imprecise. The true correlation could be much weaker or much stronger than reported.
Narrow confidence intervals come from larger datasets. If your CI is wide, consider extending the time range to gather more data points.
Data Points — Sample Size Matters
The data points count shows how many sentiment-price pairs were available for analysis. More data = more reliable results:
- 200+ data points: Recommended for strong conclusions
- 50–200 data points: Acceptable but interpret with caution
- 30–50 data points: Minimum threshold (configurable) — results are suggestive at best
- < 30 data points: Analysis will not run — insufficient data
Reliability Badge — Did It Survive Multiple Testing?
The reliableBest flag is perhaps the most important indicator. When SentiSignal tests 49 different lags, some will appear correlated purely by chance. The system applies Benjamini-Hochberg FDR correction to filter out false positives.
If reliableBest = true, the best lag survived this correction — it is genuinely statistically significant, not an artifact of testing many hypotheses simultaneously.
Example Walkthrough
Let's put it all together with a concrete example. Suppose your Correlation Sweep returns:
- Best Lag: +12 hours
- Pearson r: 0.38
- p-value: 0.003
- Data points: 180
- reliableBest: true
The interpretation: "Sentiment today correlates with price 12 hours later with moderate strength (r=0.38). The relationship is statistically significant (p=0.003) and survived FDR correction, meaning it is unlikely to be a false positive. With 180 data points, the sample size is adequate for reliable conclusions."
This is a result worth incorporating into your analysis workflow. It suggests that monitoring sentiment shifts could give you a 12-hour window to anticipate price direction for this asset.

Why This Matters
Misreading results is worse than not running the analysis at all. A trader who sees r=0.15 with 40 data points and treats it as a reliable signal will make poor decisions. Understanding each metric — and how they work together — lets you distinguish genuine insights from statistical noise. Continue to Confidence Levels to learn how SentiSignal classifies result quality automatically.