Top Deviations Table — Finding the Best Lag
Learn to read the ranked lag table and spot robust signals versus fragile one-off correlations.

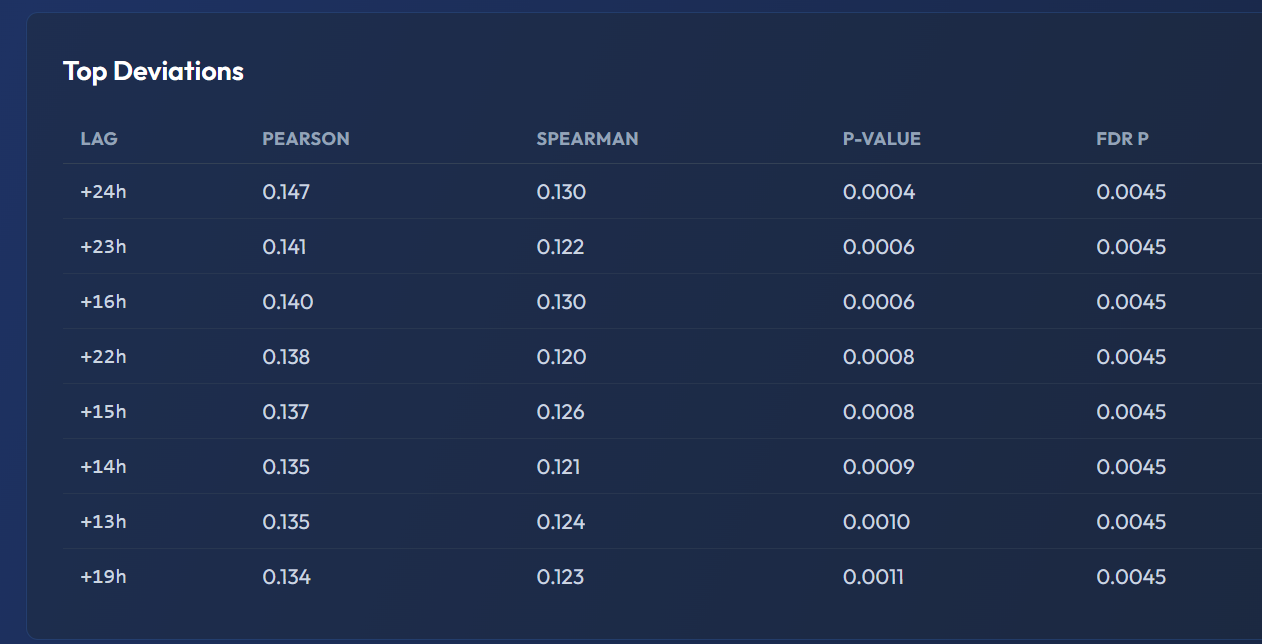
What the Top Deviations Table Shows
Below the headline metrics in every Correlation Sweep result, you will find the Top Deviations Table. This table lists all tested lags ranked by correlation strength, giving you the full picture rather than just the single "best" lag.
Understanding the Columns
Each row represents one tested lag with the following columns:
- LAG (hours): The time offset tested — positive means sentiment leads price, negative means sentiment follows price.
- PEARSON (r): The Pearson linear correlation coefficient at this specific lag.
- SPEARMAN (r): The rank-based Spearman correlation at this lag.
- P-VALUE: The raw statistical significance for this lag.
- FDR P (adjusted): The Benjamini-Hochberg FDR-corrected p-value, accounting for multiple comparisons.
- SIG (YES/NO): Whether this lag survived FDR correction. A green "YES" means the correlation at this lag is genuinely significant — not a statistical artifact from testing many hypotheses.
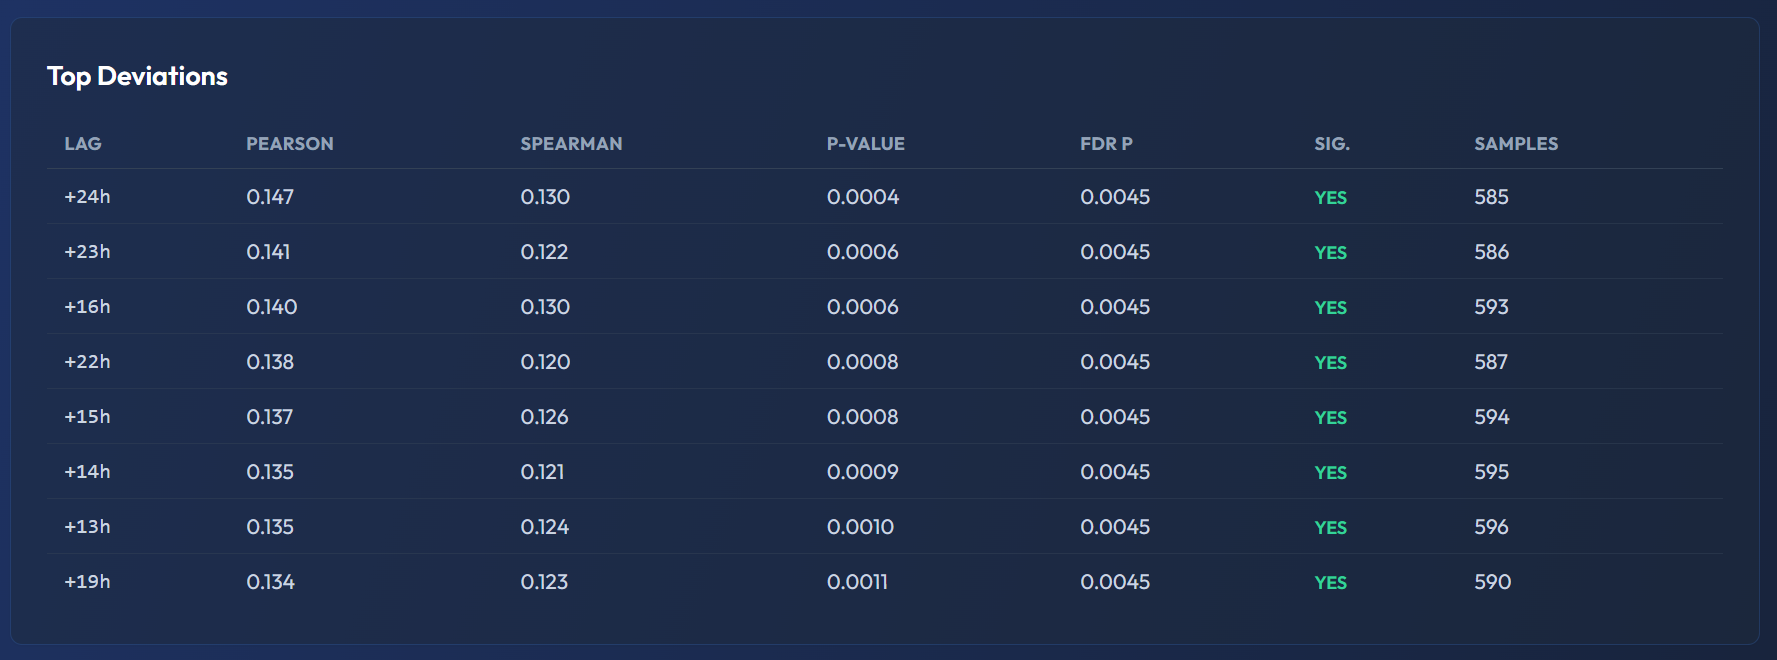
In this screenshot you can see 8 rows for the OP 90-day analysis. All rows show positive lags (+13h to +24h) with green "YES" in the SIG. column, confirming all survived FDR correction. The top row: +24h, Pearson 0.147, Spearman 0.130, P-VALUE 0.0004, FDR P 0.0045, 585 samples. Notice how the Pearson values are clustered tightly (0.134–0.147) across adjacent lags — this indicates a broad, robust signal rather than one fragile data point.
The SIG Column Is Your Best Friend
The SIG column is the single most important column in this table. Raw p-values can be misleading when you test 49 lags simultaneously, because some will look significant purely by chance. The SIG column applies FDR correction to eliminate these false positives.
Rule of thumb: only trust lags marked "YES" in the SIG column for making analytical decisions.
Interpreting Patterns in the Table
The real power of the Top Deviations Table comes from reading patterns across multiple rows, not just the top row:
Pattern 1: Multiple Adjacent Significant Lags
If several neighboring lags all show SIG = YES (e.g., +10h, +11h, +12h are all significant), this is a robust signal. The relationship between sentiment and price is not fragile to exact timing — it exists across a time window. This is the most reliable type of finding.
Pattern 2: Single Isolated Significant Lag
If only one lag shows SIG = YES while all neighbors show "NO," the signal is more fragile. It may still be genuine, but proceed with greater caution — a single significant lag out of 49 tests could be a survivor of the FDR correction by a narrow margin.
Pattern 3: Pearson/Spearman Disagreement
If Pearson r and Spearman r disagree substantially at the same lag (e.g., Pearson r = 0.45 but Spearman r = 0.20), the relationship is likely non-linear. A few extreme data points may be driving the Pearson correlation. In these cases, Spearman is more trustworthy.
Practical Use: Identifying Your Trading Time Horizon
The Top Deviations Table directly answers: "What is my time window for acting on sentiment?"
For example, if lags +4h through +8h all show r > 0.3 with SIG = YES, you know:
- The sentiment-to-price relationship exists across a 4-hour window (from +4h to +8h)
- This gives you a practical trading time horizon — when sentiment shifts, you have approximately 4 to 8 hours before the correlated price movement
- Acting at +2h (too early) or +12h (too late) falls outside the strongest signal window
FDR Correction — Why It Matters
When testing 49 lags simultaneously at a significance threshold of p < 0.05, you would expect approximately 2.5 false positives (49 × 0.05) purely by random chance — even if no real relationship exists. Without correction, you might act on these phantom signals.
The Benjamini-Hochberg FDR correction adjusts for this. Only lags that survive this stricter threshold earn a "YES" in the SIG column. This is why a result with zero SIG = YES lags is actually informative: the data does not support any sentiment-price relationship at any tested lag for this asset and time range.
Why This Matters
The headline "best lag" metric gives you a single number. The Top Deviations Table gives you the full story — whether the signal is robust or fragile, concentrated or diffuse, linear or non-linear. Always check this table before making any decisions based on Correlation Sweep results. For a deeper dive into which specific news sources drive the strongest signals, see How to Read Source Predictability Results.