How to Read Source Predictability Results
Interpret the source leaderboard to find which news outlets lead or lag price and which ones to watch closely.

The Source Leaderboard
When you run a Source Predictability analysis in SentiLab, the results rank every news source by how well its sentiment correlates with future price movement. Instead of looking at sentiment in aggregate (like Correlation Sweep), Source Predictability breaks the signal down per source.
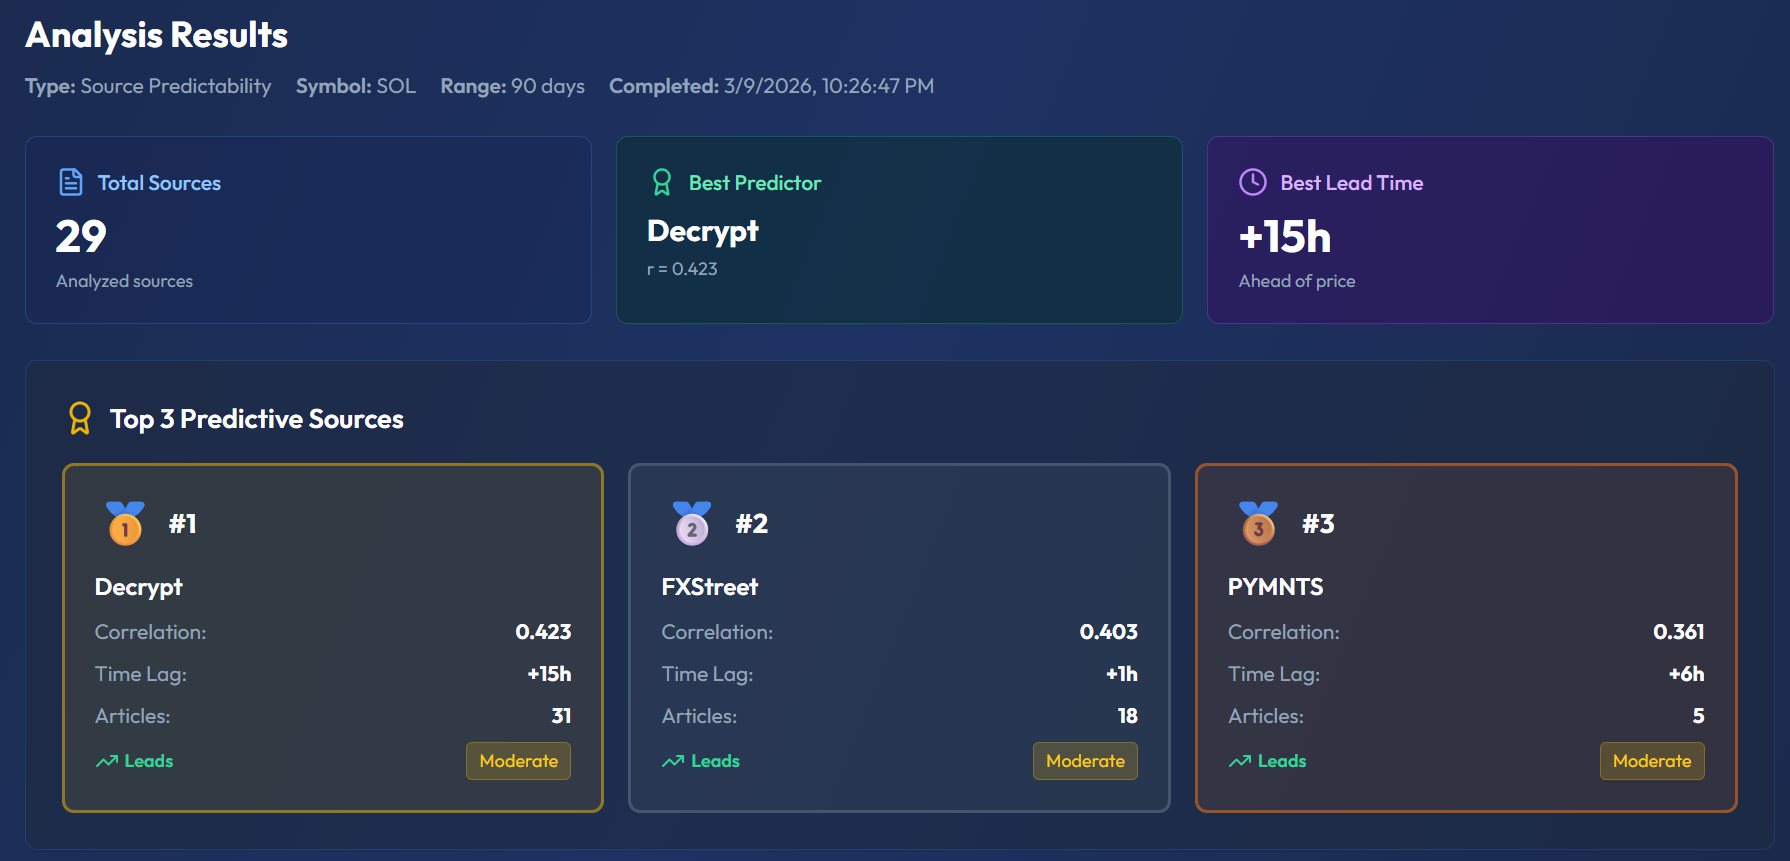
This screenshot shows Source Predictability results for SOL (Solana) over 90 days. The summary row: 29 Total Sources analyzed, Best Predictor: Decrypt, Best Lead Time: +15h ahead of price. Below that, the Top 3 Predictive Sources cards: #1 Decrypt (correlation 0.423, +15h, 31 articles, "Leads", Moderate badge), #2 FXStreet (0.403, +15h, 18 articles, "Leads"), #3 PYMNTS (0.361, time lag shown, 5 articles, "Leads", Moderate). Each card is color-coded by rank (gold, silver, bronze).
Key Fields for Each Source
Each source in the leaderboard includes:
- Source Name: The news outlet (e.g., CoinDesk, The Block, Reuters)
- Article Count: How many articles from this source were included in the analysis
- Best Lag (hours): The time offset at which this source's sentiment shows the strongest correlation with price
- Correlation (Pearson r): The strength of the correlation at the best lag
- Lag Label: A human-readable label (e.g., "+8h") for quick scanning
Leading vs Lagging Sources
The lag direction is critical for understanding each source's role:
- Leading sources (positive lag): Their sentiment correlates with future price movement. These are predictive — the market hasn't fully priced in their information yet.
- Lagging sources (negative lag): Their sentiment correlates with past price movement. These are reactive — they report on events after the price already moved.
Focus your monitoring on leading sources. If a source consistently leads price by +8 hours, shifts in their sentiment coverage become an early warning signal.
Article Count and Reliability
A source showing r = 0.7 with only 10 articles is far less reliable than a source showing r = 0.4 with 100 articles. Small sample sizes produce unstable correlations — the value could swing dramatically with a few more articles.
When evaluating sources, weigh both correlation strength and article count. The ideal source has a moderate-to-strong correlation AND a substantial article count.
Top 3 Sources
The results panel highlights the top 3 leading sources separately for quick reference. These are the sources with the highest positive-lag correlations (filtered by a minimum article count threshold). Use these as your shortlist for daily monitoring.
Complete Leaderboard
Below the top 3, the complete leaderboard ranks every source from #1 through #N. Scroll through this list to understand the full landscape:
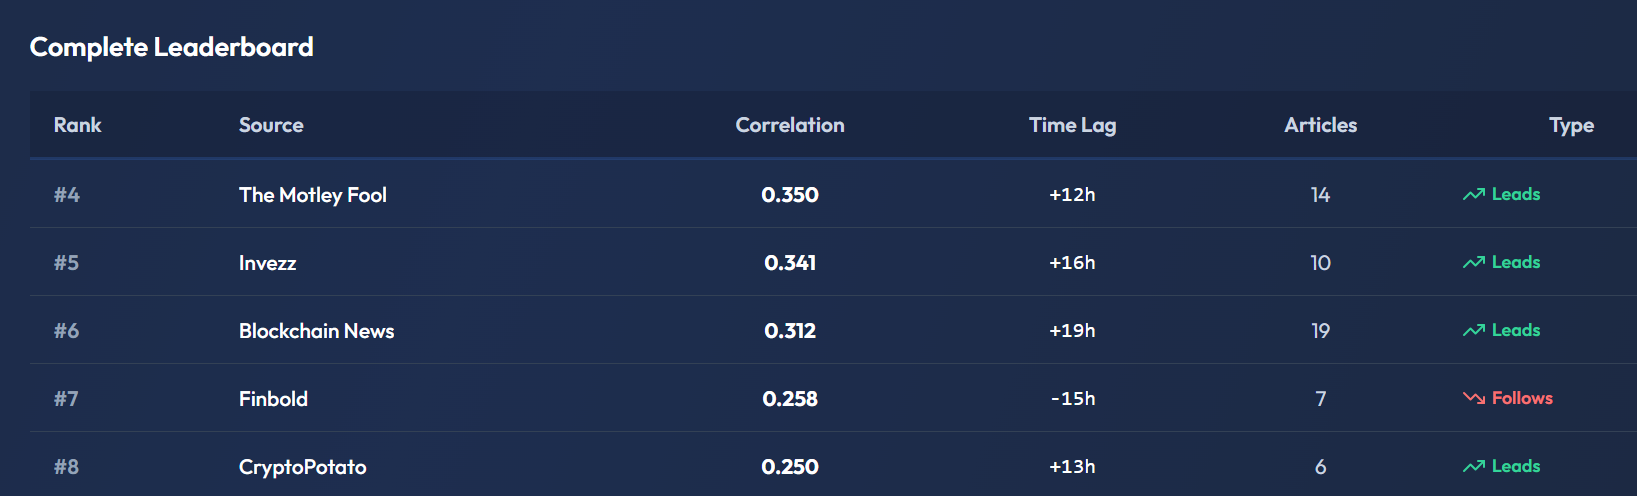
The screenshot shows the "Complete Leaderboard" table with columns: Rank, Source, Correlation, Time Lag, Articles, and Type. Entries #4–#8 are visible: The Motley Fool (0.350, +12h, 14 articles, "Leads" in green), Invezz (0.341, +16h, 10, Leads), Blockchain News (0.312, +19h, 19, Leads), Finbold (0.258, -15h, 7, "Follows" in red), and CryptoPotato (0.250, +13h, 6, Leads). Notice Finbold is the only source here with a negative lag (Follows) — it publishes after price moves.
- Sources near the top with positive lags: your best predictive signals
- Sources in the middle with near-zero lags: synchronized but not predictive
- Sources near the bottom with negative lags: reactive reporters, less useful for anticipation
Practical Application
Once you have identified your top leading sources:
- Bookmark them: Check their pages in the Sources directory regularly to monitor their latest analyzed articles.
- Monitor sentiment shifts: When 2+ leading sources shift sentiment in the same direction within a short window, pay attention.
- Cross-reference with Source Quality: SentiSignal also tracks source credibility and quality scores. The ideal sources to follow are both credible (trustworthy journalism) and predictive (their sentiment leads price). A source that leads price but publishes unreliable content is not a good signal.
Why This Matters
Not all news sources are created equal. Some break stories that move markets; others summarize events after the fact. Source Predictability quantifies this distinction, letting you focus your limited attention on the sources most likely to give you an informational edge. Next, learn how to assess overall result quality in When Results Are Reliable and When They're Not.