How to Save Experiments
Save your SentiLab configurations and results for future reference, comparison, and reuse.

Why Save Experiments?
Every SentiLab analysis involves a specific combination of filters, parameters, and results. Without saving, you would need to remember and reconfigure these settings each time. Saved experiments create a persistent library of your research that you can revisit, compare, and build upon.
How to Save
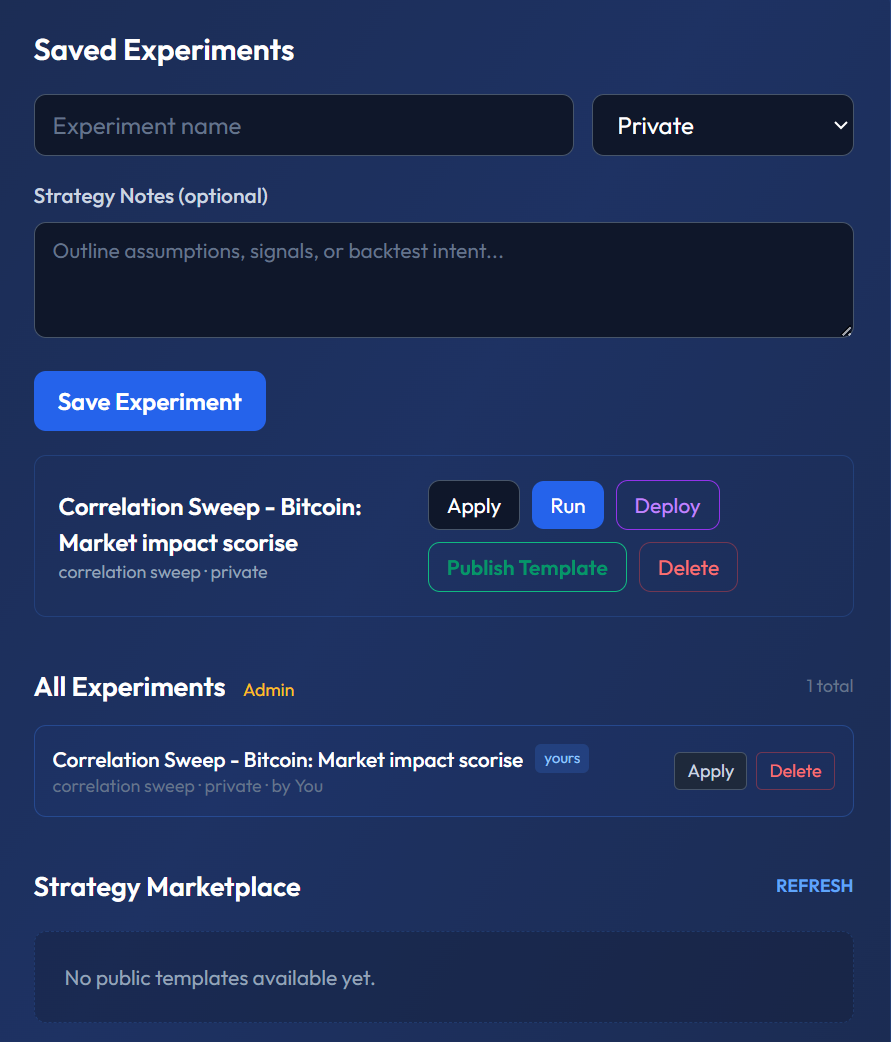
After running any SentiLab analysis — whether a Correlation Sweep, Source Predictability, or Narrative Clustering — click the "Save Experiment" button in the results panel. This stores both your configuration and the complete results.
What Gets Saved
Each saved experiment captures:
- All filter parameters: Asset, time range, quality thresholds, lag range, predictive-only toggle, and every other configuration option you set
- Analysis type: Which SentiLab tool you used (Correlation Sweep, Source Predictability, Narrative Clustering)
- Results JSON: The complete output — correlations, lags, p-values, source rankings, everything
- Timestamp: When the analysis was run, so you know how fresh the results are
Naming Your Experiments
Give each experiment a descriptive name that captures the key parameters at a glance. Good examples:
- "BTC 90d High Quality Correlation Sweep" — immediately tells you the asset, time range, filter quality, and analysis type
- "ETH Source Predictability Q1 2026" — captures the asset, analysis, and time period
- "EUR/USD Extended Lag Sweep minQuality 0.8" — includes non-default parameters
Avoid vague names like "Test 1" or "Quick check" — you will not remember what they mean in a week.
Accessing Saved Experiments
Your saved experiments appear in the "Saved Experiments" panel directly on the /lab page. From here you can:
- View results: Instantly see the full output without re-running the analysis
- Reproduce: Load the saved configuration and re-run with updated data (new articles published since your last run)
- Compare: Open two experiments side by side to see how results changed over time or across different parameters
Re-Running with Updated Data
Markets evolve, and new articles are published daily. A Correlation Sweep you ran 30 days ago may produce different results today because the dataset has grown. Use the re-run feature to apply the same configuration to the latest data and see if your original findings still hold.
This is particularly useful for validating whether a sentiment-price relationship is persistent or was driven by a single event.
Template Mode
Mark an experiment as a template to save the configuration without results. Templates serve as reusable starting points — for example, you might create a template called "Standard BTC Analysis" with your preferred quality filters and lag range, then apply it to different time periods without reconfiguring each time.
Building a Research Library
Over time, your saved experiments become a research library. This library enables you to:
- Track how sentiment-price relationships evolve across market cycles
- Compare results across assets using identical configurations
- Identify which parameter combinations consistently produce the strongest signals
- Document your analytical journey for personal review or team collaboration
Why This Matters
Professional research is reproducible research. Saving experiments ensures you never lose a finding, never re-do work unnecessarily, and can always trace back to the exact configuration that produced a result. Next, learn how to add context to your experiments with Strategy Notes.