Leading and Lagging — When Sentiment Predicts Price
Learn how cross-correlation analysis reveals whether news sentiment leads, lags, or moves in sync with asset prices.

The Core Question
Every trader and analyst using sentiment data eventually asks the same question: Does news sentiment actually predict price moves, or does it just react to them?
SentiSignal answers this question quantitatively using Cross-Correlation Function (CCF) analysis — a statistical technique that measures the Pearson correlation between sentiment and price at different time offsets.
Understanding Time Lags
The CCF tests whether there is a correlation between sentiment at time T and price at time T + offset, across a range of offsets:
Negative Lag (Sentiment Leads)
A negative lag means sentiment is being compared to future price. For example, a lag of -4 hours means: "we compare sentiment at time T with price at time T+4h." If the correlation is strong at this lag, it suggests that sentiment leads price by 4 hours — when sentiment rises today, price tends to rise 4 hours later.
This is the most interesting result for traders, because it implies the sentiment data has predictive value.
Positive Lag (Sentiment Follows)
A positive lag means sentiment is compared to past price. A lag of +4 hours means: "we compare sentiment at time T with price at time T-4h." If the correlation is strong here, it suggests that sentiment follows price by 4 hours — the media is reacting to price moves rather than predicting them.
This is less interesting for prediction but still useful — it confirms that news coverage is responsive to market events.
Zero Lag (Synchronized)
A strong correlation at lag 0 means sentiment and price move at the same time. The news and the market are responding to the same events simultaneously.
The Results Widget
On each asset page, the "Leading/Lagging Analysis" widget displays the CCF results:
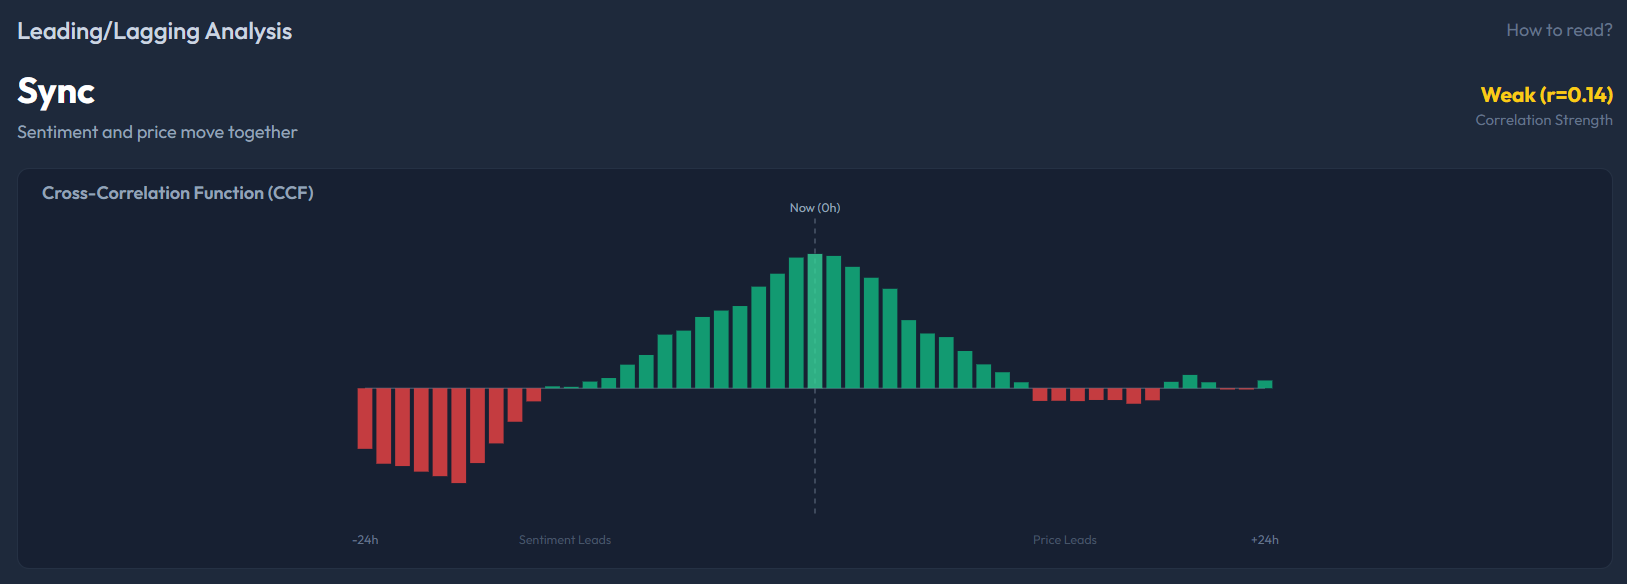
In the screenshot above you can see the widget for XRP. At the top left it displays "Sync" — the verdict that sentiment and price move together. On the top right: "Weak (r=0.14)" in yellow, indicating a weak correlation strength. The bar chart below shows the CCF values: green bars represent positive correlation at each lag, and red bars represent negative correlation. The tallest green bars cluster around "Now (0h)" (center line), confirming the Sync verdict. The X-axis labels help orientation: -24h on the left with "Sentiment Leads" label, and +24h on the right with "Price Leads" label.
The widget shows three key pieces of information:
- A verdict at the top — "Sync" (sentiment and price move together), "Sentiment Leads" (predictive), or "Price Leads" (reactive)
- The correlation strength — rated as Weak, Moderate, Strong, or Very Strong with the Pearson r value
- A CCF bar chart showing correlation at each tested lag from -24h to +24h
Interpreting Correlation Strength
The Pearson correlation coefficient (r) ranges from -1 to +1:
- |r| ≤ 0.1 — Weak: No meaningful relationship between sentiment and price at this lag
- 0.1 < |r| ≤ 0.3 — Moderate: Some relationship exists. Worth noting but not strong enough to act on alone.
- 0.3 < |r| ≤ 0.5 — Strong: A meaningful correlation. Sentiment data at this lag is providing genuine signal.
- |r| > 0.5 — Very Strong: High predictive value. For example, r=0.62 at lag=-4h means "when sentiment rises today, price tends to rise 4 hours later with 62% correlation."
Example Interpretation
Suppose the CCF analysis for Bitcoin shows:
- Best lag: -6 hours
- Pearson r: 0.48
- Classification: Sentiment LEADS price
This means that Bitcoin's LLM sentiment scores show a strong correlation with price 6 hours later. When the sentiment average rises at noon, the price tends to rise by 6 PM. This is a predictive signal — sentiment data for BTC is forward-looking, at least over this time window.
Why Some Assets Lead More
Not all assets show the same lag patterns:
- Retail-heavy assets (BTC, ETH, DOGE, SOL) tend to show sentiment leading price. This may be because retail traders consume news and act on it with a delay, creating a lag between sentiment shift and price response.
- Institutional-heavy assets (GOLD, EUR/USD, OIL) often show sentiment lagging price. Institutional traders have faster information channels and algorithms, so they move price before the news is widely published and analyzed.
- Low-liquidity assets can show noisy results because the small number of articles creates unreliable statistics.
Going Deeper with SentiLab
The asset page widget provides a summary, but for rigorous analysis with advanced filters and statistical controls, use SentiLab's Correlation Sweep. There you can:
- Set custom time ranges (90 days recommended for reliability)
- Filter by minimum quality score
- Test extended lag ranges (up to ±7 days)
- View FDR-adjusted p-values for statistical rigor
Why It Matters
Leading/lagging analysis is what separates informational sentiment data from actionable sentiment data. If sentiment consistently leads price for an asset, you can use sentiment shifts as an early warning system. If it consistently lags, sentiment data is better used for confirming moves after the fact rather than predicting them.
Understanding this distinction helps you calibrate your expectations and build more effective analysis workflows — combining leading sentiment assets with price action analysis on lagging ones for a complete market view.