How to Use AI Chart Analysis
Let SentiSignal's LLM-powered engine interpret price action, sentiment trends, and top news — all in one automated analysis.

What Is AI Chart Analysis?
AI Chart Analysis is SentiSignal's automated, LLM-powered interpretation of the combined price and sentiment chart. Instead of manually reading chart lines and scanning news headlines, you can ask the AI to synthesize everything into a coherent, written analysis — covering price action, sentiment statistics, Fear & Greed context, and the most impactful news stories.
Think of it as having an on-demand analyst who reads every data point on your chart and writes you a summary in 30–60 seconds.
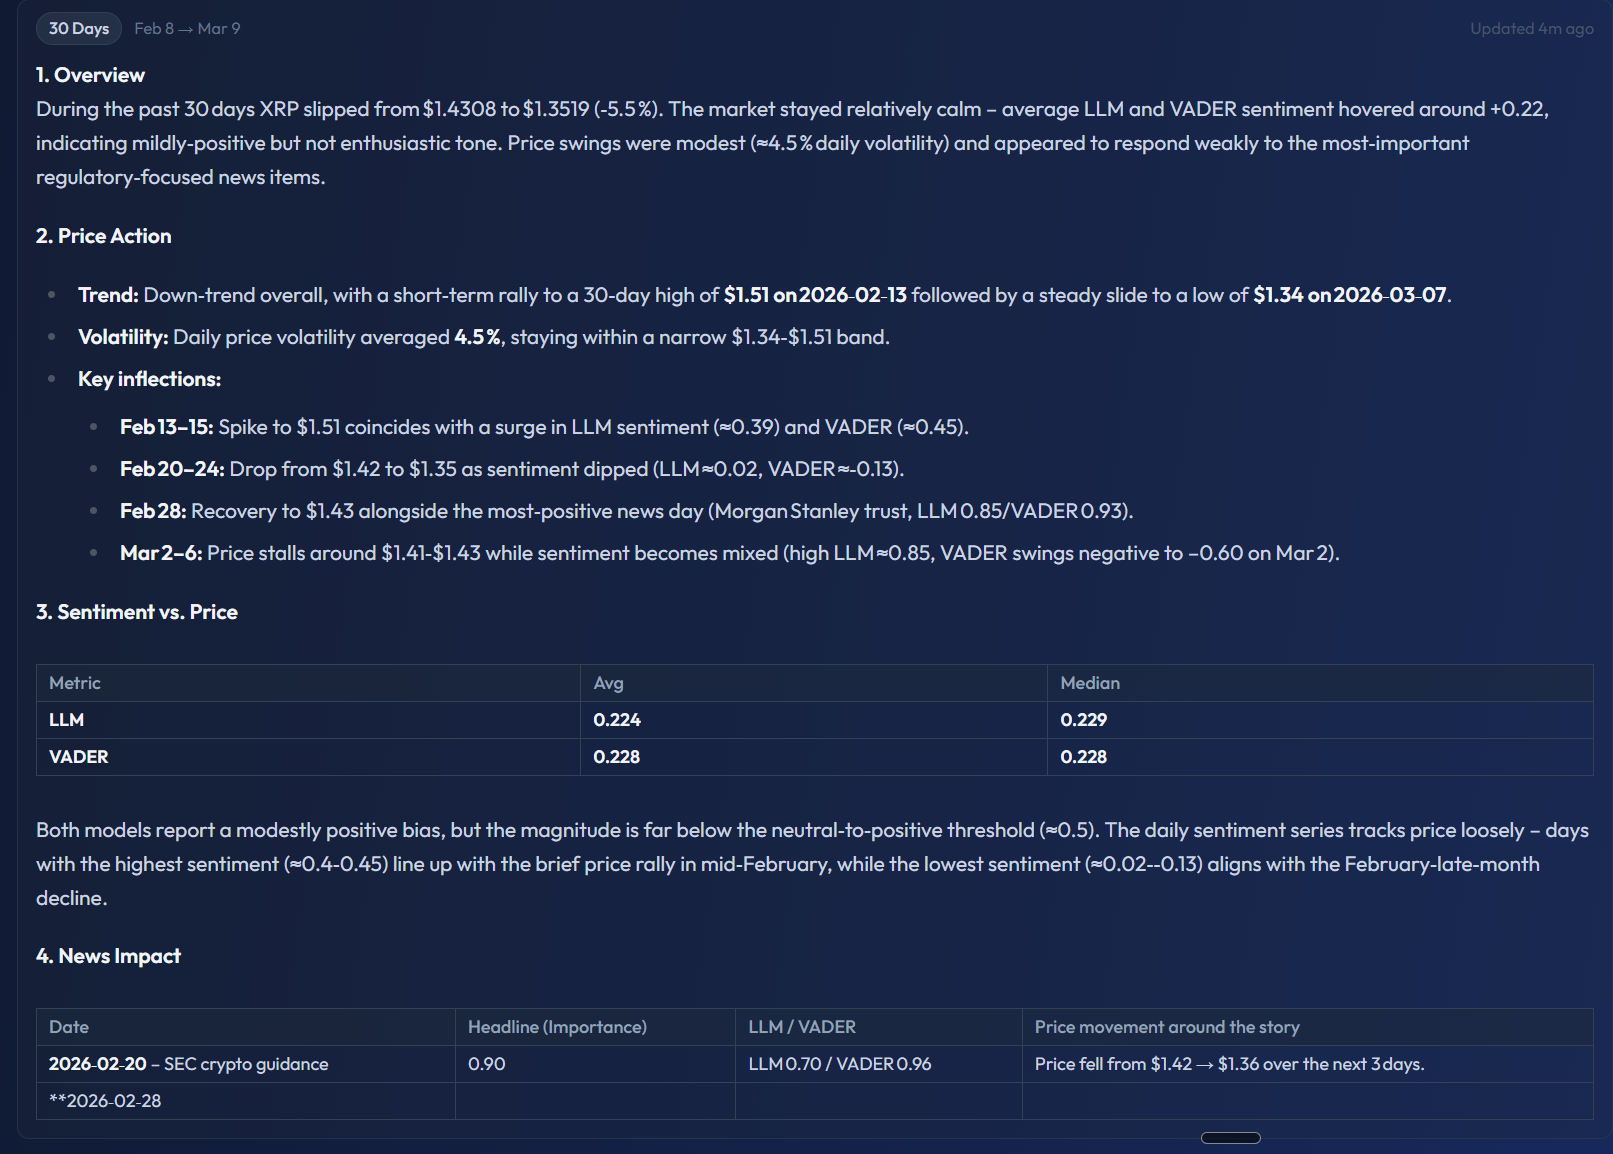
The screenshot shows a 30-day AI analysis for XRP. The analysis is structured into numbered sections: 1. Overview (price range $1.29–$1.51, market "relatively calm", sentiment +0.22), 2. Price Action (trend direction, volatility 4.5%, key inflection points like the Feb 13–15 spike), 3. Sentiment vs Price (a table comparing LLM and VADER averages, Pearson correlations — LLM r=0.224, VADER r=0.238), and 4. News Impact (a table listing specific headlines with their sentiment and price movement in the days following). This is the typical structure you can expect from any AI Chart Analysis.
How to Access It
Navigate to any asset page (for example, Bitcoin or Solana). Scroll below the main sentiment vs price chart, and you will see an "Analyze chart" button.
- Click the "Analyze chart" button.
- The system collects the relevant data: price OHLC, LLM sentiment averages, VADER sentiment averages, Fear & Greed index, lag/lead analysis (for timeframes ≥ 7d), and top news articles ranked by importance × quality × credibility.
- This data bundle is sent to the LLM (Groq — gpt-oss-120b, running on the free 8k TPM tier).
- Within 30–60 seconds, the AI returns a markdown-formatted analysis that renders directly below the chart.
Available Timeframes
AI Chart Analysis is available for all chart timeframes:
- Short-term: 1h, 3h, 12h
- Medium-term: 1d, 3d, 7d
- Long-term: 30d, 90d, 1y, All
Each timeframe produces a distinct analysis tailored to that window. A 1-hour analysis will focus on intraday micro-moves, while a 90-day analysis will discuss broader trends, macro narratives, and longer-horizon sentiment shifts.
Deduplication and Caching
To avoid redundant LLM calls (and conserve API tokens), analyses are cached per time bucket. For example:
- A 7d analysis may be reused when viewing the 12h chart (same underlying data window).
- A 30d analysis may be reused for the 1d view.
This means you won't always see a new generation — if a recent analysis already covers the same bucket, it displays instantly.
Status Badges
Each analysis displays a status badge:
- Pending — the analysis is currently being generated by the LLM.
- Completed — the analysis is ready to read.
- Failed — an error occurred during generation (e.g., rate limit hit). You can retry.
- Idle — no analysis has been requested yet for this timeframe.
Other Timeframe Analyses
Below the primary analysis, you will find a collapsible "Other timeframe analyses" section. This shows all previously generated analyses for the same asset across different timeframes. It is useful for comparing how the AI interprets short-term vs long-term conditions — a 3-day analysis might be bearish while the 90-day view remains bullish.
What Data Does the AI Receive?
Regardless of which chart toggles you have active in the UI, the AI always receives the full data set:
- Price OHLC — open, high, low, close for each candle in the timeframe.
- Avg LLM Sentiment — average sentiment score from AI language model analysis.
- Avg VADER Sentiment — average sentiment from the rule-based VADER algorithm.
- Fear & Greed Index — the crypto-wide market mood indicator.
- Lag/Lead Analysis — for timeframes ≥ 7d, includes which direction (sentiment → price or price → sentiment) shows the strongest correlation.
- Top N News — the most impactful articles ranked by importance × quality × credibility.
Why This Matters
AI Chart Analysis saves you time and reduces cognitive load. Instead of cross-referencing three sentiment lines, a price chart, Fear & Greed, and multiple articles, you get a single written summary that connects the dots. It is especially useful for assets you follow casually — run a quick analysis instead of spending 15 minutes reading charts and news. For a deeper dive into what the AI covers in its price section, continue to Price Action and Trend Analysis.