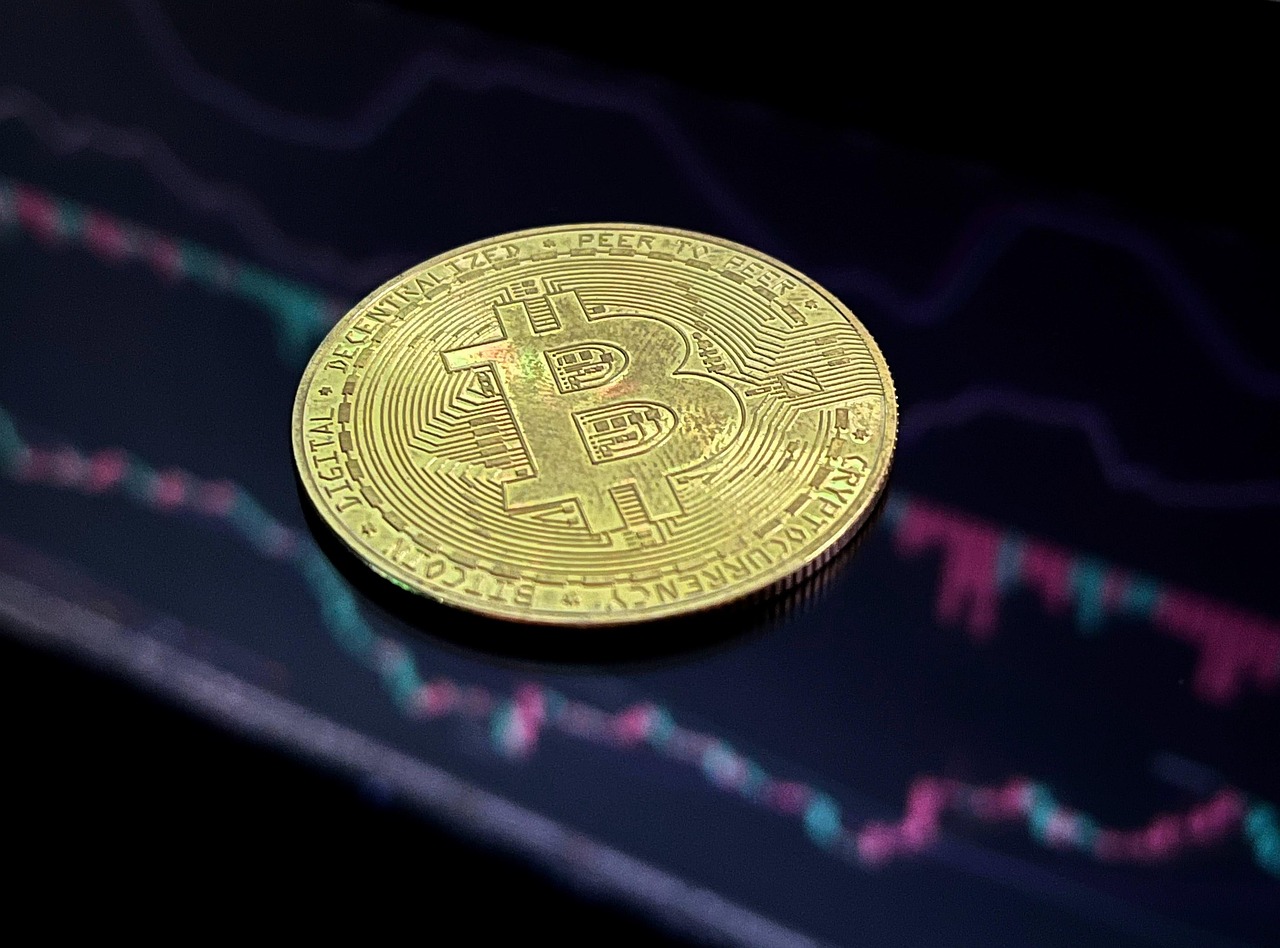
Global financial markets recently experienced significant turbulence, with Bitcoin (BTC) notably sliding below the $62,000 threshold, as escalating geopolitical tensions between the United States and Iran triggered a sharp rally in crude oil prices and intensified inflationary concerns [3] [6] [15]. The catalyst for this market shift was President Donald Trump's declaration at the NATO summit in Ankara, Turkey, that the ceasefire arrangement with Iran was "over," following reports of military actions and counter-actions in the Middle East [3] [4] [11] [12] [14] [15] [18] [19]. This geopolitical development immediately impacted risk-sensitive assets, leading to a broad market sell-off across equities, precious metals, and cryptocurrencies, while simultaneously boosting the U.S. dollar and sovereign bond yields [6] [12] [14] [15] [18] [19] [21]. The renewed instability in the strategically vital Strait of Hormuz, a critical artery for global oil shipments, propelled Brent crude futures past $80 per barrel and U.S. WTI crude past $75 per barrel, reigniting fears of persistent inflation and prompting market participants to reassess the trajectory of global monetary policy [3] [6] [8] [11] [12] [14] [15] [18] [19] [21].
Geopolitical Instability and Energy Market Volatility
The recent surge in global market volatility was primarily driven by a rapid escalation of tensions between the United States and Iran. President Donald Trump, speaking at the NATO summit in Ankara, Turkey, publicly declared the ceasefire agreement with Iran "over," a statement that immediately sent ripples through financial markets [3] [4] [11] [12] [14] [15] [18] [19]. This announcement followed a series of military engagements, including U.S. military forces conducting strikes targeting Iranian positions on Tuesday in response to assaults on three commercial oil vessels operating near the Strait of Hormuz [3] [14]. Tehran reportedly retaliated with its own military actions, with Iran’s Islamic Revolutionary Guards Corps claiming strikes on 85 U.S. military sites in Bahrain and Kuwait, and announcing the downing of a U.S. MQ-9 unmanned aerial vehicle [14] [20]. President Trump further cautioned that Iran would face another "hard" strike that evening, with the Pentagon subsequently confirming additional operations had been executed [3].
The geopolitical developments had an immediate and pronounced effect on energy markets. Brent crude futures momentarily surpassed the $80 per barrel threshold, marking their strongest performance since June 22, while U.S. WTI crude climbed past $75 per barrel during the session [3]. Brent crude jumped 6.24% to reach $78.82 per barrel, marking its second consecutive day of gains, and West Texas Intermediate increased 5.2% to settle at $74.12 per barrel [12] [19]. The average price for Brent crude oil during the three-month period ending in June was $96.68 per barrel, representing a 23% climb from the previous quarter, with prices peaking at $109.27 per barrel in April, the highest level since 2022 [8]. This dramatic rise in oil prices was fueled by concerns over regional stability and potential disruptions to oil supply routes through the critical Strait of Hormuz, which handles approximately one-fifth of worldwide oil transportation [6] [8] [11] [12] [14] [18]. Washington's decision to revoke a general license that had previously permitted Iranian oil production and sales activities further added upward pressure on prices, reinforcing the flight from risk-sensitive assets [3] [18] [20] [21]. Energy sector equities, such as Exxon Mobil, defied the wider market weakness, with shares advancing approximately 3% in Wednesday’s pre-market hours following a regulatory filing that indicated substantial second-quarter profit growth, propelled by elevated crude oil prices [8]. Competing oil majors like ConocoPhillips and Chevron also experienced similar momentum, climbing 4.69% and 3.52% respectively [8].
Bitcoin's Resilience Amidst Macro Headwinds
Bitcoin (BTC) experienced a notable decline, exceeding 2% on Wednesday, as the heightened tensions between the United States and Iran disrupted global financial markets [3]. The leading cryptocurrency by market capitalization retreated to approximately $62,115, down from levels above $64,600 observed earlier in the trading week [3]. Other reports indicated Bitcoin's price dropped to $62,031, a 2.71% decline, and to $62,870 after stalling at the $64,000 resistance zone [6] [20]. This initial sell-off was a predictable reaction, as traders dumped crypto, oil jumped, and stocks went lower, creating a classic risk-off move [2]. Cryptocurrency analyst Michaël Van de Poppe suggested that Bitcoin might test the $61,000 support zone, noting that markets often reverse within a day or two after such headline-driven events [3]. Analyst Ted observed a hidden bearish divergence pattern on Bitcoin's daily timeframe chart, cautioning that Bitcoin needed to reclaim $62,500 soon to avoid further downside [3].
Despite the initial dip, Bitcoin demonstrated a degree of resilience, with buyers showing up almost immediately to prevent bears from gaining momentum [2]. By the morning, much of the fear had dissipated, and Bitcoin had recovered most of its losses [2]. This recovery occurred even as spot Bitcoin ETFs recorded $84 million in net outflows, ending a three-day buying streak [2]. Normally, such outflows would weigh on sentiment, but Bitcoin "ignored the script," frustrating traders who anticipate every negative headline to become a lasting trend [2]. However, the broader context for crypto remains fragile; a $7.7 billion stablecoin contraction and anemic Bitcoin ETF inflows have placed the crypto market on a structurally weak footing [20]. While Bitcoin ETFs have seen over $200 million in July inflows, these barely dent the more than $6 billion in outflows over the past two months, indicating that institutional positioning has improved but not fully recovered, leaving crypto vulnerable to continued macro pressure [21]. Analysts also point to a massive long liquidity cluster, with around $1.4 billion in Bitcoin long positions at risk of liquidation if BTC drops to $53,500, roughly 15% below current spot prices [21]. Ethereum also moved lower but avoided the heavier selling that hit Bitcoin during the first wave, holding relatively steady and avoiding a meaningful breakdown, despite a weekly death cross forming and momentum indicators remaining soft [2].
Precious Metals: A Divergent Safe-Haven Narrative
The escalating geopolitical tensions and renewed inflation concerns had a complex impact on precious metals, traditionally considered safe-haven assets. Gold futures lost ground, and spot gold decreased 1.2% to $4,057.09 per ounce, with futures contracts experiencing even steeper losses, falling 2.2% to $4,066.56 per ounce [4] [14]. Gold prices (XAU/USD) came under significant selling pressure, declining around 2% to approximately $4,046 [11]. This decline occurred despite gold's traditional role as a safe haven, as stronger U.S. rate expectations and higher Treasury yields limited buying interest [11]. Elevated interest rates typically diminish gold’s appeal to investors because the precious metal generates no income, and a strengthening U.S. dollar can increase gold’s cost for international purchasers [14].
Silver also came under significant pressure, declining 4.0% [15]. Silver fell 2.61% to $58.39 per ounce, platinum decreased 3.47% to $1,589.17, and palladium lost 3.19% to $1,212.94 [14]. Instead of benefiting from increased demand for safe-haven assets, silver continued to decline alongside other risk-sensitive investments [7]. Analysts noted a significant speculative long bias in silver, suggesting that further price declines could lead to elevated long liquidation risks [7].
Global gold ETF flows continued to see outflows in June, with physically backed gold ETFs experiencing outflows of US$8.9 billion in the month, and all regions reporting outflows [1]. Despite this, global gold ETF flows have remained positive year-to-date [1]. By the end of June, global gold ETFs’ Assets Under Management (AUM) reached US$526 billion, a 6% fall in the first half of the year, mainly due to a lower gold price, though collective holdings in the first half were up 18 metric tons to 4,047 metric tons [1]. Gold market trading volumes pulled back in June, yet the first-half average reached an all-time high [1]. In contrast to the general market trend, central banks utilized gold's sell-off last month to boost their official gold reserves, with the People's Bank of China notably buying 15 metric tons in June, marking its largest purchase year-to-date [22]. The European Central Bank (ECB) also marked down its gold holdings by €160 billion for Q2, to €1.23 trillion, after having marked them up by €113 billion for Q1, reflecting variations in the market price of gold expressed in euros [5].
Global Equities and Sovereign Debt: Broad Market Contraction
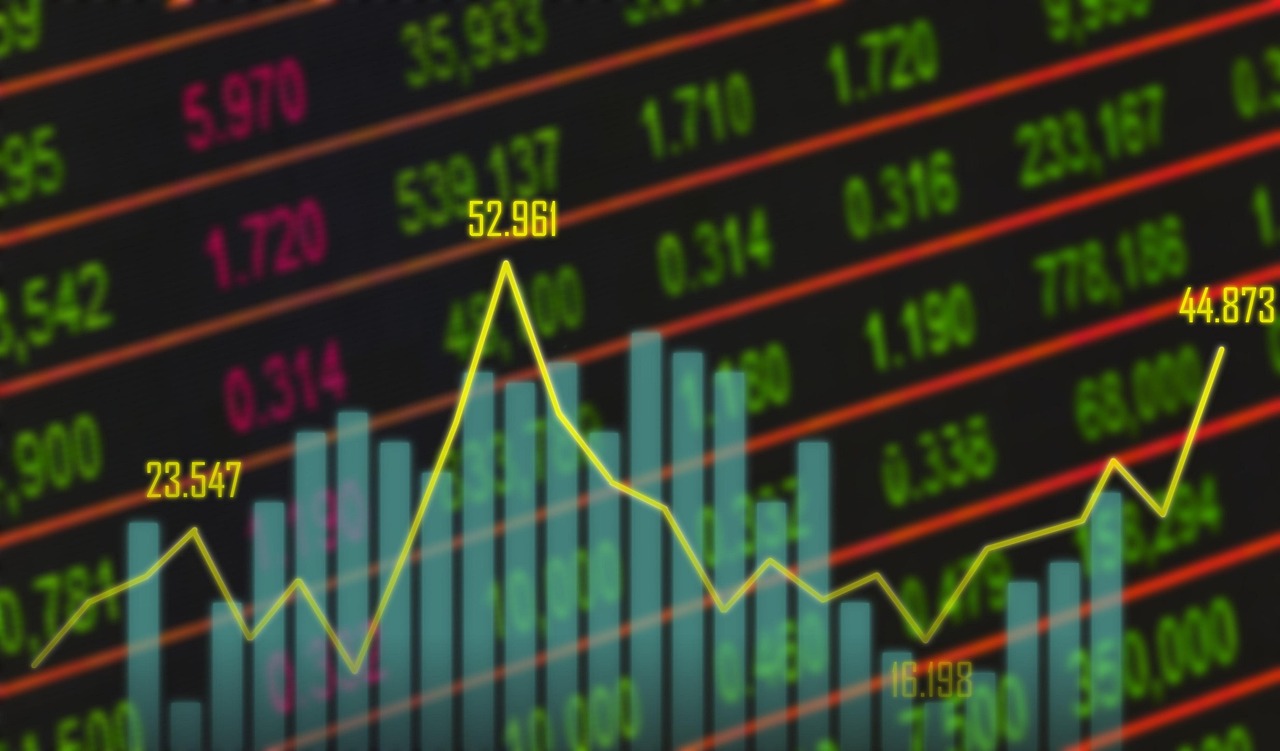
The geopolitical developments and rising oil prices triggered a broad market contraction across global equities and sovereign debt markets. U.S. equity futures came under pressure on Wednesday morning, with Dow Jones futures retreating 1.08%, S&P 500 futures declining 0.86%, and Nasdaq 100 futures shedding 1.4% [6] [17] [19]. The Cboe Volatility Index futures advanced 2.03%, signaling heightened market uncertainty [6]. All three primary U.S. stock indices had concluded Tuesday’s session in negative territory, with the S&P 500 decreasing 0.5%, the Nasdaq falling 1.2%, and the Dow closing down 0.3% [19].
European equity markets experienced significant declines, with the broad-based STOXX 600 index shifting from a marginal 0.4% loss to a substantial 1.7% decline after President Trump’s statements became public [18]. Germany’s benchmark DAX index tumbled 2.4%, France’s CAC 40 shed 2.2%, and the UK’s FTSE 100 and Italy’s FTSE MIB both recorded losses exceeding 1.5% [18]. Asian equity markets also closed lower, with Japan’s Nikkei 225 dropping 2.11% and China’s Shanghai Composite declining 0.49% [6]. South Korea’s KOSPI plunged 5.4% for the session, driven by losses in semiconductor stocks, and now sits 22.8% beneath its June 22 peak, breaching the 20% decline threshold that traditionally signals a technical bear market [13] [15] [19]. Asian economies, due to their substantial oil import dependency, are particularly vulnerable to rising energy costs [19].
In the sovereign debt markets, Treasury yields across the curve advanced, reflecting expectations of elevated energy expenses and a hawkish monetary policy stance. The 10-year Treasury yield advanced to 4.574%, while the benchmark 10-year yield reached a four-week high of 4.60% [6] [12]. The two-year note yield rose to 4.24% [12]. Ten-year sovereign debt yields also shot up across Europe, with increases of 11 basis points in France, ten basis points in the U.K. and Italy, nine basis points in Spain and New Zealand, and eight basis points in Germany [15]. These movements indicated diminished appetite for risk-sensitive assets and a shift towards more defensive market positioning [18].
Central Bank Policies and Inflationary Pressures
The resurgence of geopolitical tensions and the associated surge in oil prices have significantly influenced central bank outlooks and intensified concerns about inflationary pressures. Minutes from the Federal Reserve’s June 16-17 policy meeting revealed significant disagreement among committee members regarding the appropriate trajectory for interest rates, with several participants advocating for immediate rate increases [3]. The majority highlighted multiple scenarios where inflationary pressures could remain persistent, citing potential energy supply disruptions in the Middle East, artificial intelligence-driven demand growth, and tariff implementations [3]. Recent CME FedWatch data indicates an increasing probability of a rate hike at the September policy meeting, and traders on prediction platform Kalshi currently assign 55% odds to a rate increase occurring sometime in 2026 [3]. Elevated interest rate expectations typically create headwinds for speculative investment vehicles, including digital currencies [3].
The market is closely monitoring the Federal Reserve’s stance, especially under newly installed Chairman Kevin Warsh, who has communicated a preference for reduced forward guidance compared to previous Fed leadership [12] [18]. Approximately half of Federal Reserve policymakers during the previous meeting suggested openness to additional rate increases should inflation prove persistent [18]. Francesco Pesole, FX strategist at ING, anticipates the minutes will confirm a hawkish policy stance, which would provide additional support for dollar appreciation [12]. Consumer inflation expectations have also become "unanchored," according to a New York Fed survey, with median inflation expectations for one year from now rising to 3.67%, the highest since September 2023, and for three years from now rising to 3.34%, the highest since June 2022 [23]. The Fed's favored "Core" PCE price index, excluding volatile energy and food components, has been accelerating since mid-2025, reaching 3.4% year-over-year in May 2026, and the six-month annualized core PCE price index accelerated to 4.1%, the worst in three years [23]. Rising oil prices imply higher inflation, which in turn leads to higher interest rates [16].
Beyond the U.S., other central banks are also navigating complex monetary policy landscapes. The European Central Bank (ECB) shed €149 billion of its Quantitative Easing (QE) assets in Q2, bringing the total reduction to €3.70 trillion ($4.22 trillion), or 52%, since the peak in mid-2022 [5]. The ECB also hiked its policy rates by 25 basis points at its June 11 meeting, to 2.25%, and raised its inflation projection for the end of 2026 to 3%, following a clear tightening strategy [5]. The Bank of Japan (BOJ) has belatedly launched and accelerated its QT program, even selling outright its stock-market traded equity ETFs and J-REITs, though it has only hiked policy rates in minuscule steps to 1.0% [5]. The Reserve Bank of New Zealand (RBNZ) lifted its Official Cash Rate by 25 basis points to 2.50% in an expected move, indicating that further reduction in monetary stimulus is likely required to return inflation to its 2 percent target midpoint, given inflation at 3.1% in the last two reported quarters [10] [12] [15]. In contrast, the Bank of Israel cut its central bank’s interest rate for a second straight time by 25 basis points, trimming it to 3.50%, its lowest point since the end of 2022, as actual CPI inflation of 1.9% holds just below its 1-3% target midpoint [9]. U.S. mortgage applications dropped 2.2% last week, with the average contract interest rate for 30-year fixed-rate mortgages increasing to 6.58% from 6.57% [15] [16]. Applications to refinance a home loan dropped 4% for the week, and applications for a mortgage to purchase a home fell 1% [16].
Sector-Specific Dynamics: The Tech Divide
The broader market turbulence also manifested in distinct sector-specific dynamics, particularly within the technology industry, where a notable divide emerged between semiconductor manufacturers and Chinese internet companies. Samsung Electronics experienced a sharp 6.3% decline on Wednesday, despite delivering a remarkable second-quarter earnings report that projected a nineteenfold surge in operating profit, fueled by robust appetite for high-bandwidth memory chips powering artificial intelligence (AI) servers [13]. The impressive figures failed to clear the elevated bar set by the market, leading to investor disappointment [13]. This weakness extended across the semiconductor sector, with SK Hynix declining 5.7% and Micron, an American competitor, closing Tuesday down 4.7% and falling another 6.6% in Wednesday’s premarket session [13] [17] [19]. The widespread selling drove South Korea’s KOSPI index down 5.4% for the session, pushing it into technical bear market territory, sitting 22.8% beneath its June 22 peak [13] [19]. Japanese chip suppliers also relinquished early advances, with Murata Manufacturing sliding approximately 2%, TDK dropping nearly 2%, and Sony declining around 1% [13]. Analysts suggested that the market had already incorporated a substantial beat into valuations for companies at the "epicenter of the hottest sector in the whole market," leading to profit-taking [13].
In stark contrast, Chinese technology names experienced a significant rally, driven by a reallocation of capital. Alibaba’s American Depositary Receipts (ADRs) rocketed 11% to $109.38 during Wednesday’s premarket session, marking the stock’s most significant single-session rally in Hong Kong trading since September [17]. This surge was attributed to an analyst briefing where Alibaba indicated its rapidly expanding instant-commerce segment experienced narrowing losses during the June quarter, while the company maintained stable profitability across its operations [6] [17]. Additionally, reports highlighted accelerating growth in Alibaba Cloud’s artificial intelligence operations, with the company moving to integrate its AI agent capabilities into a unified platform [6]. This positive sentiment extended to other Chinese tech giants, with JD.com climbing 3.8%, Baidu advancing 6.4%, and Tencent posting gains of nearly 4% [17]. The Hang Seng Tech Index rallied approximately 5% [17]. Market participants appear to be seeking more attractive valuations within the AI investment theme, as Chinese internet companies, which had previously tumbled into bear market territory in Hong Kong, present lower price-to-earnings multiples compared to their elevated U.S. and Korean peers [17]. Indications that China’s artificial intelligence sector is advancing into hardware development, with companies like DeepSeek and Zhipu reportedly developing proprietary chip technology, further contributed to the optimistic sentiment [17].
Conclusion
The recent market movements underscore a complex interplay of geopolitical, monetary, and sector-specific factors. Bitcoin's initial slide below $62,000 was a direct response to escalating U.S.-Iran tensions and the subsequent surge in oil prices, reflecting a broader risk-off sentiment across global markets [3] [6] [15] [20]. While Bitcoin demonstrated some resilience by recovering most of its losses, the underlying market structure remains fragile, influenced by stablecoin contractions and inconsistent ETF inflows [2] [20] [21]. The geopolitical instability, particularly concerning the Strait of Hormuz, has reignited inflation fears, prompting central banks like the Federal Reserve and the ECB to maintain or consider hawkish monetary policies, which typically create headwinds for speculative assets and non-yielding assets like gold [3] [5] [11] [14] [18] [19] [23]. This environment saw traditional safe havens like gold and silver also decline, contrary to typical patterns, due to the overriding influence of rising interest rate expectations and a strengthening U.S. dollar [7] [11] [14]. Meanwhile, global equities experienced widespread declines, with semiconductor stocks facing significant pressure, while Chinese technology companies saw a notable rally driven by capital reallocation and improving earnings outlooks [6] [13] [17] [18] [19]. The market remains at a critical juncture, with ongoing geopolitical developments, central bank communications, and upcoming corporate earnings poised to shape the near-term trajectory of various asset classes.
![[crypto] Bitcoin (BTC) Slides Under $62K as Iran Tensions Escalate and Oil Surges](/uploads/thumbnails/crypto-bitcoin-btc-slides-under-62k-as-iran-tensions-escalate-and-oil-surges-3.jpg)
![[crypto] Bitcoin (BTC) Slides Under $62K as Iran Tensions Escalate and Oil Surges](/uploads/thumbnails/crypto-bitcoin-btc-slides-under-62k-as-iran-tensions-escalate-and-oil-surges.jpg)