![[crypto] Bitcoin (BTC) Slides Under $62K as Iran Tensions Escalate and Oil Surges](/uploads/thumbnails/crypto-bitcoin-btc-slides-under-62k-as-iran-tensions-escalate-and-oil-surges.jpg)
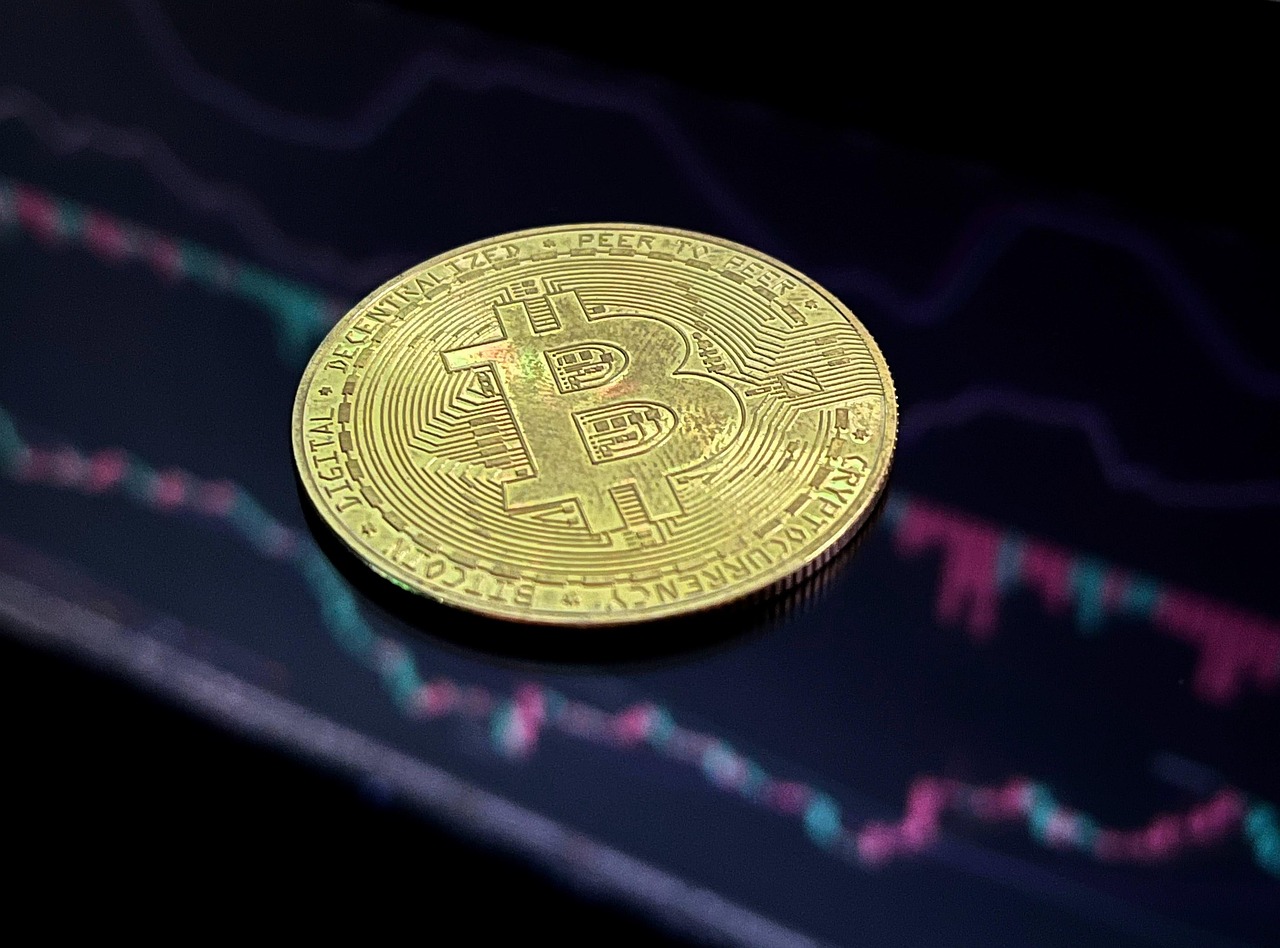
Global financial markets experienced significant turbulence this week, characterized by a notable decline in Bitcoin's valuation, which retreated below the $62,000 threshold. This market movement unfolded amidst escalating geopolitical tensions between the United States and Iran, which triggered a sharp surge in crude oil prices and intensified concerns about persistent inflation. The confluence of these factors, alongside shifting expectations for global monetary policy and a broad sell-off in the technology sector, contributed to a complex and volatile trading environment across various asset classes.
\n\nGeopolitical Tensions Drive Market Volatility and Oil Surge
\nThe primary catalyst for recent market instability appears to be the renewed escalation of tensions between the United States and Iran. On Wednesday, President Donald Trump, speaking at the NATO summit in Ankara, Turkey, declared the ceasefire arrangement between the two nations "over" [1] [2] [7] [8] [10] [11] [14] [15]. This declaration followed a series of military actions, including U.S. strikes targeting Iranian positions on Tuesday in response to assaults on three commercial oil vessels operating near the strategically vital Strait of Hormuz [1]. Tehran reportedly retaliated with its own military actions, with Trump further cautioning Iran about another "hard" strike, which the Pentagon subsequently confirmed had been executed [1].
\nIran's Islamic Revolutionary Guards Corps claimed responsibility for strikes on 85 U.S. military sites in Bahrain and Kuwait, and also announced the downing of a U.S. MQ-9 unmanned aerial vehicle [10] [16]. The Pentagon characterized its operations as retaliatory for Iranian assaults on commercial vessels in the Strait of Hormuz, reporting engagements with over 80 targets within Iranian territory and more than 60 Iranian naval craft in the strategic waterway [10]. Washington also revoked a general license that had previously permitted Iranian oil production and sales activities, a move that further exacerbated market anxieties [1] [15] [16]. The UK Maritime Trade Operations agency confirmed that a tanker sailing near Oman’s coastline was struck by an unknown projectile, resulting in a fire onboard [26]. Iranian officials have reportedly mandated that all vessels transiting the Strait of Hormuz must follow Iranian-designated shipping corridors and warned that any American intervention would trigger "a rapid and decisive action" [26]. The 60-day negotiating window outlined in the Memorandum of Understanding between the U.S. and Iranian governments has approximately six weeks remaining [20].
\nThese geopolitical developments had an immediate and pronounced impact on crude oil markets. Brent crude futures momentarily surpassed the $80 per barrel threshold, marking their strongest performance since June 22 [1]. U.S. WTI crude climbed past $75 per barrel during the session [1]. Brent crude jumped 6.24% to $78.82 per barrel, marking its second consecutive day of gains [8]. West Texas Intermediate crude oil was observed to be 5% higher on balance versus Tuesday's close, at one point poking above $75 per barrel compared to just $67 two days prior [11]. The dramatic rise in oil prices rekindled worries about energy-related inflationary pressures, a development that could complicate the Federal Reserve’s ability to reduce interest rates in the coming months [15]. Analysts at Deutsche Bank noted that despite prices normalizing after an earlier peace agreement, vessel traffic through the Strait of Hormuz remains significantly below historical norms, indicating ongoing supply-chain stress [26]. However, upward price momentum faced some resistance from expanding global supply, as OPEC+ members agreed to raise production allocations by 188,000 barrels daily commencing in August [26]. The United Arab Emirates reported production exceeding 3.8 million barrels per day throughout June, surpassing its pre-conflict output capacity [26]. Saudi Aramco also lowered the official selling price for Arab Light crude destined for Asian markets, the first such discount since 2020, signaling intensified competition [26].
\nThe escalating tensions also influenced other traditional safe-haven assets. Gold prices (XAU/USD) came under significant selling pressure, declining around 2% to approximately $4,046 [7]. Spot gold decreased 1.2% to $4,057.09 per ounce, while gold futures contracts experienced even steeper losses, falling 2.2% to $4,066.56 per ounce [10]. Silver also experienced heavy pressure, declining alongside other risk-sensitive investments, with spot silver tumbling 2.1% to $60.76 per ounce [4] [27]. Platinum decreased 3.47% to $1,589.17, and palladium lost 3.19% to $1,212.94 [10]. Despite gold’s traditional role as a safe-haven asset, stronger U.S. rate expectations and higher Treasury yields limited buying interest [7]. The U.S. dollar, conversely, strengthened, with the Dollar Index advancing 0.2% to approximately 101.17, reaching its strongest position since early July [8]. This strengthening dollar typically exerts downward pressure on precious metal valuations [27]. Lukman Otunuga, Head of Market Research at FXTM, characterized gold as standing at a "critical crossroads," where geopolitical turmoil and inflation anxieties compete against weaker American economic indicators that might constrain the Federal Reserve’s policy options [10]. China's central bank, however, used gold's selloff last month to boost its official gold reserves, adding 15 metric tons in June, marking its largest purchase year-to-date [17].
\n\nBitcoin's Retreat and Technical Indicators
\nBitcoin (BTC), the leading cryptocurrency by market capitalization, experienced a decline exceeding 2% on Wednesday [1]. The digital asset retreated to approximately $62,115, down from levels above $64,600 observed earlier in the trading week [1]. Bitcoin's price dropped to $62,870 on Wednesday after stalling at the $64,000 resistance zone, with fresh U.S. military strikes against Iran delivering a decisive blow to an already fragile risk appetite [16]. Bitcoin had previously printed a 21-month low of $57,742 on July 1 amid rate-hike fears [16]. The causal chain from U.S.-Iran tensions to BTC price is not theoretical; geopolitical risk of this magnitude raises energy-cost expectations, tightens financial conditions sentiment, and pushes institutional allocators toward capital preservation [16]. Bitcoin, as one of the most liquid 24/7 risk instruments, absorbed that flight in real time [16].
\nCryptocurrency analyst and trader Michaël Van de Poppe shared on X that Bitcoin might test the $61,000 support zone, having previously indicated there was "no problem" with Bitcoin’s price movement provided it maintained levels above $60,000 [1]. Another analyst, Ted, observed on X that Bitcoin had developed a hidden bearish divergence pattern on its daily timeframe chart, cautioning that Bitcoin needs to reclaim $62,500 soon, or "else things could get ugly" [1].
\nAdding to the downward pressure on the crypto market was a significant $7.7 billion stablecoin contraction, which signals a capital exit rather than a rotation within the crypto ecosystem [16]. This stablecoin contraction, combined with geopolitical shock and anemic Bitcoin ETF inflows, has placed the crypto market on a structurally weak footing [16].
\nDespite the price decline, U.S.-listed spot Bitcoin exchange-traded funds (ETFs) logged three consecutive trading sessions of net positive inflows through Tuesday, according to SoSoValue tracking data [1]. This trend helped offset a prior sequence of outflows and bolstered Bitcoin’s rebound from its late-June price lows [1]. However, Glassnode analytics revealed that Bitcoin has been trading beneath its True Market Mean level of $76,600 and the short-term holder cost basis of $72,200 for approximately five months [1]. Daily ETF trading volumes, ranging from $650 million to $950 million, represent roughly 80% below the peak levels recorded in October 2025 [1].
\n\nMacroeconomic Headwinds: Inflation and Monetary Policy Outlook
\nThe surge in crude oil prices has reignited concerns about a fresh inflationary surge across global economies [10]. Minutes from the Federal Reserve’s June 16-17 policy meeting, published Wednesday, revealed significant disagreement among committee members regarding the appropriate trajectory for interest rates [1]. Several participants advocated for immediate rate increases, with the majority highlighting multiple scenarios where inflationary pressures could remain persistent, citing potential energy supply disruptions in the Middle East, artificial intelligence-driven demand growth, and tariff implementations [1]. Recent CME FedWatch data indicates an increasing probability of a rate hike at the September policy meeting, while traders on prediction platform Kalshi currently assign 55% odds to a rate increase occurring sometime in 2026 [1]. Elevated interest rate expectations typically create headwinds for speculative investment vehicles, including digital currencies and precious metals [1] [7] [10] [27].
\nMarkets continue to expect the Federal Reserve to keep interest rates elevated for an extended period [7]. The central bank maintained its benchmark rate at 3.5% to 3.75% during its June session, although certain policymakers projected potential rate increases in 2026 [10]. The release of the FOMC meeting minutes is highly anticipated, as it could provide fresh insight into future U.S. monetary policy and influence gold’s next directional move [7] [8] [10] [14] [15] [25] [27]. Under newly installed Chairman Kevin Warsh, the Fed has streamlined its policy communication and declined to publish his own rate forecasts, departing from established precedent [8]. Nine out of 18 Federal Open Market Committee members recently indicated support for at least one additional rate increase before the year concludes [8]. Francesco Pesole, FX strategist at ING, indicated an anticipation that the minutes will confirm a hawkish policy stance, which would provide additional support for dollar appreciation [8]. Warsh has communicated a preference for reduced forward guidance relative to previous Fed leadership, creating uncertainty among investors regarding future monetary policy direction [14]. Approximately half of Federal Reserve policymakers during the previous meeting suggested openness to additional rate increases should inflation prove persistent [14].
\nConsumer inflation expectations have also become a point of concern for the Fed. Consumers’ median inflation expectations for one year from now rose to 3.67%, the highest since September 2023 [18]. Expectations for three years from now rose to 3.34%, the highest since June 2022 [18]. The "Core" PCE price index, a Fed-favored inflation metric, has been accelerating since mid-2025, with the year-over-year core PCE price index rising to 3.4% in May 2026 [18]. The six-month core PCE price index accelerated to 4.1% annualized, the worst in three years [18]. These rising medium-term inflation expectations could be a factor in allowing inflation to fester, as they influence consumer and business behavior [18].
\nGlobally, other central banks are also navigating complex monetary policy landscapes. The European Central Bank (ECB) shed €149 billion of its Quantitative Easing (QE) assets in Q2, marking a 52% reduction since mid-2022, totaling €3.70 trillion [3]. The ECB also hiked its policy rates by 25 basis points at its June 11 meeting, raising them to 2.25%, and increased its inflation projection for the end of 2026 to 3% [3]. The Bank of Japan (BOJ) belatedly launched its QT program at the end of 2024, accelerating its pace and even selling outright its stock-market traded equity ETFs and J-REITs [3]. However, the BOJ has only hiked its policy rates in minuscule steps, reaching just 1.0%, its highest in decades but still comparatively low [3]. A BOJ board member, Toichiro Asada, indicated that more definitive evidence of demand-driven price pressures would be required before authorities consider additional rate adjustments [8]. In contrast, the Reserve Bank of New Zealand (RBNZ) lifted its Official Cash Rate by 25 basis points to 2.50%, reversing a cut of that size made last November [6] [8] [11]. The RBNZ stated that with inflation (3.1% in the last two reported quarters) still above target and economic activity expected to strengthen, some further reduction in monetary stimulus is likely to be required [6] [11]. Meanwhile, the Bank of Israel cut its central bank’s interest rate for a second straight time by 25 basis points, trimming it to 3.50%, its lowest point since the end of 2022 [5]. This was the fifth reduction of that size since January 2024, as actual CPI inflation of 1.9% is holding just below its 1-3% target midpoint [5].
\n\nBroader Market Contagion: Equities and Semiconductors
\nThe geopolitical and macroeconomic pressures translated into broad-based declines across global equity markets. European equity markets experienced significant declines on Wednesday, with the broad-based STOXX 600 index shifting dramatically from a marginal 0.4% loss at midday trading to a substantial 1.7% decline once Trump’s statements became public [14]. Germany’s benchmark DAX index tumbled 2.4%, France’s CAC 40 shed 2.2%, and the UK’s FTSE 100 and Italy’s FTSE MIB both recorded losses exceeding 1.5% [14]. In Asia, share prices dropped 2.1% in Japan, 5.4% in South Korea, 1.9% in Indonesia, and 2.2% in India [11]. U.S. futures also indicated weakness, with Dow futures tumbling approximately 680 points, representing a 1.3% decline at their lowest point, S&P 500 futures retreating 0.9%, and Nasdaq 100 futures shedding 1.4% [15]. All three benchmark indices had concluded Tuesday’s session in negative territory, with the S&P 500 decreasing 0.5%, the Nasdaq falling 1.2%, and the Dow closing down 0.3% [15]. Jim Reid, an analyst at Deutsche Bank, noted that the situation had "reignited concerns about energy supplies and geopolitical risk," characterizing risk sentiment as "weak but not as much as you may have imagined" [15].
\nThe semiconductor sector, which had enjoyed a robust rally driven by artificial intelligence (AI) enthusiasm, faced significant headwinds. Samsung Electronics witnessed a sharp 6.3% decline Wednesday after delivering a remarkable second-quarter earnings report that nonetheless left investors wanting more [9]. Samsung had projected a nineteenfold surge in operating profit for the second quarter, fueled by robust appetite for high-bandwidth memory chips powering AI servers [9]. Despite these impressive figures, which surpassed the LSEG SmartEstimate consensus of 87.3 trillion won (approximately $58.4 billion) with an actual operating profit of 89.4 trillion won (~$58.4 billion), market participants sold off memory chip stocks across the board [24] [29]. Samsung’s shares had climbed approximately 382% throughout the preceding 12-month period, suggesting that Tuesday’s announcement provided an opportunity for investors to secure profits [29]. Competitor SK Hynix experienced a 6.1% decline, while South Korea’s primary KOSPI index retreated 4.9% during the trading session, entering technical bear market territory by sitting 22.8% beneath its June 22 peak [9] [29]. Micron Technology (MU) shares also declined approximately 4.9% in early Tuesday trading, dragged down alongside its South Korean peers [24]. Micron closed Tuesday down 4.7% and fell 6.6% to $875.54 in Wednesday’s premarket session [9]. The retreat appears more aligned with a broader recalibration across AI hardware stocks following an extended, rapid rally, with concerns that major U.S. cloud computing giants may need to take on substantial debt to finance AI infrastructure, with return on investment remaining unclear [24] [29]. Goldman Sachs observed that U.S. hedge funds had been reducing exposure to technology hardware stocks for four consecutive weeks leading into earnings season, reflecting increased caution [24]. Despite the sector-wide weakness, analyst community conviction remains largely intact for Micron, with Bank of America elevating its price objective to $1,500 from $950 and UBS maintaining a $1,625 price target, characterizing the decline as a buying opportunity [24]. However, Michael Burry has allegedly established a short position in Micron, questioning whether the stock’s remarkable appreciation reflects AI enthusiasm rather than durable fundamental value [24].
\nIn a contrasting development, Chinese technology giants experienced a significant rally. Alibaba’s American Depositary Receipts rocketed 11% to $109.38 during Wednesday’s premarket session, representing the stock’s most significant single-session rally in Hong Kong trading since September [13]. This surge was driven by an analyst briefing ahead of the company’s official earnings release, where Alibaba informed analysts that its rapidly expanding instant-commerce segment experienced narrowing losses during the June quarter, while the company maintained stable profitability across its operations [13]. Shares traded in Hong Kong jumped as much as 12.5%, positioning Alibaba among the strongest performers on the Hang Seng Tech Index, which rallied approximately 5% [13]. This wasn’t an isolated phenomenon, as JD.com climbed 3.8%, Baidu advanced 6.4%, and Tencent posted gains of nearly 4% [13]. This movement suggests a meaningful shift in capital allocation patterns, with market participants appearing to seek more attractive valuations within the AI investment theme, as Chinese internet companies had tumbled into bear market territory in Hong Kong [13]. Contributing to the optimistic sentiment surrounding Chinese AI capabilities, Reuters disclosed that DeepSeek is developing proprietary chip technology to support AI infrastructure, and The Information reported that Zhipu is evaluating the design of its own AI processors [13].
\nOther notable market developments included the performance of Microsoft and SpaceX. Microsoft shares have retreated approximately 20% during 2026, hovering near $386.74, which has compressed its forward price-to-earnings ratio to 20.25x, substantially beneath the technology sector’s 24.61x average [21]. Despite this, the company’s core operations continue to demonstrate robust expansion, with Azure revenues expanding 40% year-over-year in its third fiscal quarter of 2026, exceeding Wall Street projections [21]. Azure now commands approximately 21% of worldwide cloud infrastructure services, ranking second only to Amazon Web Services [21]. Jefferies maintains a Buy recommendation on MSFT with a $675 price objective, emphasizing Microsoft as a premier opportunity within the ongoing cloud computing expansion cycle [21]. Meanwhile, SpaceX (SPCX) secured its position in the Nasdaq-100 index on Tuesday, a mere 15 days after its stock market entrance on June 12, establishing one of the swiftest index inclusions ever documented [28]. SpaceX shares declined approximately 1.5% to $158.37 in premarket trading on Tuesday, with market participants seemingly having positioned themselves ahead of this event, as SPCX shares had climbed approximately 10% from recent nadirs approaching its inclusion [28]. SpaceX, with a market valuation of $2.1 trillion, currently ranks as America’s sixth-most-valuable corporation [28].
\nIn the U.S. housing market, total mortgage application volume dropped 2.2% last week compared with the previous week, following a net 2.8% decline in the final three weeks of June [11] [12]. The average contract interest rate for 30-year fixed-rate mortgages with conforming loan balances increased slightly to 6.58% from 6.57% [12]. Applications to refinance a home loan dropped 4% for the week, while applications for a mortgage to purchase a home fell 1% [12]. More real estate agents now report seeing a balanced market between buyers and sellers, with 44% of agents surveyed in CNBC's Housing Market Survey in Q2 reporting this, up from 30% in Q3 last year [12] [23]. Home sales in May were up slightly, 3% higher than the same month last year, a result of more supply on the market and easing prices [23]. Asking prices in June were down 2.5% year-over-year, the largest annual drop since Realtor.com began tracking this in 2017 [23].
\n\nConclusion
\nThe recent decline in Bitcoin's price below $62,000 reflects a complex interplay of escalating geopolitical tensions, particularly between the U.S. and Iran, and broader macroeconomic shifts. The renewed conflict in the Middle East has driven a significant surge in crude oil prices, reigniting concerns about persistent inflation and influencing the hawkish stance of central banks, including the Federal Reserve. This environment of higher interest rate expectations typically creates headwinds for speculative assets like cryptocurrencies and even traditional safe havens like gold, which unexpectedly declined. While Bitcoin spot ETFs have seen positive inflows, overall trading volumes remain subdued, and technical indicators suggest ongoing bearish pressure. The market turbulence has also impacted global equities, with a notable sell-off in the semiconductor sector despite strong earnings, as capital reallocates towards perceived value in other areas like Chinese technology stocks. As investors continue to monitor geopolitical developments and anticipate further clarity on monetary policy from the Federal Reserve, market volatility is likely to persist, underscoring a period of heightened uncertainty across financial markets.
\n", "title": "Bitcoin Slides Below $62K Amid Iran Tensions, Oil Surge, and Fed Uncertainty", "subtitle": "Geopolitical instability and hawkish monetary policy expectations weigh on crypto and global markets, while tech sector dynamics shift.", "seo_meta": { "description": "Bitcoin's price falls below $62,000 as US-Iran tensions escalate, driving oil prices higher and fueling inflation concerns. Analysis of Fed policy, global equities, and tech sector shifts.", "keywords": ["Bitcoin price", "Iran tensions", "oil prices", "Federal Reserve", "crypto market", "geopolitics", "semiconductors"] }, "image_search_terms": ["Bitcoin chart", "oil barrels", "trading floor"] }![[crypto] Bitcoin (BTC) Slides Under $62K as Iran Tensions Escalate and Oil Surges](/uploads/thumbnails/crypto-bitcoin-btc-slides-under-62k-as-iran-tensions-escalate-and-oil-surges-3.jpg)