The Interplay of Bitcoin's Price Decline, US Dollar Strength, and Central Bank Divergence
The cryptocurrency market is experiencing significant turbulence as Bitcoin (BTC) continues its downward trajectory, dropping 23.59% from its peak to trade at $68,234.54 as of February 26, 2026. This decline comes amid a complex web of interconnected factors, including strengthening US dollar dynamics, divergent central bank policies, and shifting institutional sentiment. The Fear & Greed Index has plunged to 11, indicating extreme fear in the market and reflecting the heightened uncertainty among investors.
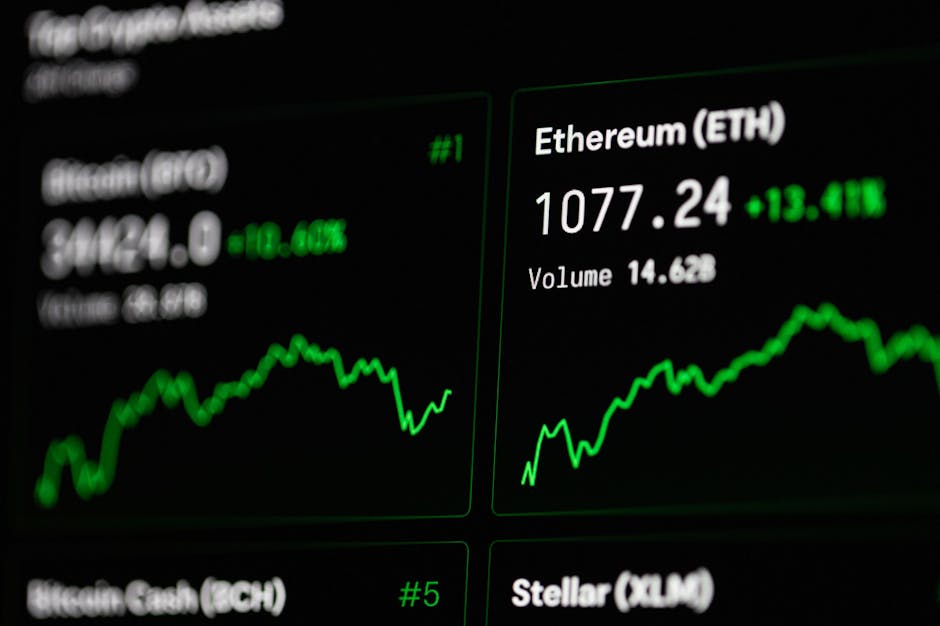
The Current State of Bitcoin Markets
Bitcoin's price action has been characterized by consolidation within a $60,000 to $70,000 range over the past 22 days, following a 35% drop between January 14 and February 5, 2026 cointelegraph.com. This sideways movement has occurred despite several adoption-linked metrics showing divergent trends across exchange-traded funds (ETFs), whale holdings, miner activity, and corporate Bitcoin treasuries.
The 90-day rolling average of US spot Bitcoin ETF net flows has dropped to -$2.18 billion, marking only the second time in two years that this metric has turned negative cointelegraph.com. The previous instance occurred between March 2025 and May 2025, which was followed by a corrective phase in Bitcoin's price. This sustained outflow from ETFs represents a significant reduction in institutional buying pressure and overall demand for Bitcoin.
Institutional Capital Flight and ETF Dynamics
The sustained negative ETF flows highlight a critical shift in institutional sentiment toward Bitcoin. When the rolling average turns negative, it indicates that more money is leaving ETFs than coming in over an extended period, which reduces buying pressure and weakens overall demand cointelegraph.com. A move back above zero, followed by steady inflows, may mark the return of institutional participation, as sustained positive readings tend to align with stronger price action from BTC alongside improving liquidity conditions.
Bitcoin's institutional buying has effectively disappeared as selling dominates the market . The same ETFs that fueled Bitcoin's rally are now pulling it apart from the inside, creating a challenging environment for price recovery. Retail investors are struggling to absorb the massive capital outflows, with $2.81 billion leaving the market .
Whale Accumulation vs. Market Trends
Despite the overall bearish sentiment, whale accumulation presents an interesting counterpoint to the dominant market trend. CryptoQuant data tracks the 1-year change in total whale holdings, revealing that large holders continue to accumulate Bitcoin even as prices decline cointelegraph.com. This divergence suggests that sophisticated investors may be positioning for a longer-term recovery, even as short-term market dynamics remain challenging.
The accumulation by whales occurs against a backdrop of declining stablecoin exchange reserves, which have fallen from $60 billion to $51.1 billion in just two months, representing a $9 billion decline that has tightened trading liquidity since January crypto.news. This liquidity drain raises significant downside risks for the broader cryptocurrency market.
Stablecoin Liquidity Crisis
The shrinking stablecoin reserves represent a major risk factor for the crypto market. Tether (USDT) exchange balances have fallen dramatically, and analysts warn that moving below $50 billion in reserves could put additional selling pressure on major assets like XRP, ETH, and BTC crypto.news. Stablecoins serve as the primary source of trading activity in cryptocurrency markets, and falling balances usually signify a drop in investor confidence.
The number of active wallet addresses has also rapidly decreased, from about 376,000 to 263,000, indicating that retail investors and institutions are becoming increasingly cautious about market participation crypto.news. This reduction in active addresses compounds the liquidity challenges facing the market.
Bitcoin vs. Gold: Diverging Safe-Haven Narratives
The relationship between Bitcoin and gold has become increasingly complex as both assets navigate different market dynamics. While Bitcoin struggles to maintain its position above $70,000, gold has climbed nearly 199% over the past five years, now trading above $5,181 per ounce bitcoinist.com. This divergence raises questions about Bitcoin's status as "digital gold" and its effectiveness as a safe-haven asset.
Bitcoin's recent performance differs from its long-standing pattern of moving with stocks. Over the past six months, it has lagged while equities remained stable and gold rose newsbtc.com. This trend has created an unusually weak correlation between Bitcoin and traditional financial markets, recalling rare periods when crypto briefly moved independently from broader financial markets.
The correlation between Bitcoin and the S&P 500 has hit its weakest level since the FTX crash in 2022, according to analytics firm Santiment newsbtc.com. This breakdown in correlation suggests that Bitcoin may be establishing its own market identity, separate from traditional risk assets.
Technical Analysis and Price Levels
Bitcoin faces growing downside risks after rejecting major resistance near $69,700 coingape.com. Weak bullish volume and loss of key support levels now raise the probability of a corrective move toward $62,000. The market briefly pushed higher but failed to sustain acceptance above a key Fibonacci resistance level, signaling exhaustion among buyers.
The rejection becomes more significant when viewed through volume dynamics. Despite the upward move, bullish participation has remained relatively weak compared to prior impulsive expansions coingape.com. Rising prices without corresponding volume expansion often indicate a lack of conviction among buyers. Instead of sustained accumulation, the rally appears driven more by short-term positioning rather than strong market demand.
Following the rejection, Bitcoin has now moved back below the Point of Control, reinforcing the bearish technical structure. The inability to secure sustained acceptance above the $65,000 psychological threshold has reinforced caution among traders, leaving Bitcoin in what increasingly resembles a defensive phase .
US Dollar Strength and Federal Reserve Policy
The strengthening US dollar plays a crucial role in Bitcoin's price dynamics. As the dollar gains strength, it typically creates headwinds for risk assets, including cryptocurrencies. The Federal Reserve's monetary policy stance has become increasingly important for Bitcoin's price trajectory.
Bitcoin has fallen below the psychological $68,000 level following the release of US initial weekly jobless claims ambcrypto.com. The macro data came in below expectations, signaling that the labor market is indeed rebounding, which makes a case for the Fed to hold rates steady at the March FOMC meeting. Department of Labor data shows that the weekly claims for the week ending February 21 were 212,000, below expectations of 215,000 ambcrypto.com.
This labor market strength could further delay more rate cuts as the Fed focuses on rising inflation. The Fed made three cuts last year to address weakness in the labor market, but the current data suggests that additional cuts may not be necessary in the near term. Fed Governor Chris Waller has stated that his support for a March rate cut will depend on the February jobs report ambcrypto.com.
Central Bank Divergence and Global Monetary Policy
The divergence in central bank policies across different regions creates a complex environment for Bitcoin and other risk assets. While the Federal Reserve may be inclined to maintain higher interest rates due to strong labor market data, other central banks may be pursuing different strategies based on their domestic economic conditions.
This policy divergence affects currency exchange rates and capital flows, which in turn impact Bitcoin's price. The strengthening US dollar, supported by relatively hawkish Fed policy, creates additional pressure on dollar-denominated assets like Bitcoin.
Market Sentiment and Psychological Factors
The Fear & Greed Index has slipped to cycle lows, reflecting the extreme caution among market participants crypto.news. This sentiment deterioration compounds the technical and fundamental challenges facing Bitcoin. The combination of negative ETF flows, declining stablecoin reserves, and weakening price action creates a self-reinforcing cycle of pessimism.
However, some analysts point to Bitcoin's oversold conditions as a potential signal for a bottom. Alex Thorn, Galaxy Digital's head of research, noted that Bitcoin's weekly relative strength index (RSI) has printed at roughly 25.7, lower than any time in recent history cryptopotato.com. This extreme oversold condition could indicate that the market is due for a relief rally, though the timing and magnitude remain uncertain.
The $33 Billion Drain: Realized Cap Analysis
Bitcoin's realized cap has cratered as capital abandons the network for a second consecutive month, with a $33 billion drain representing a significant reduction in the network's economic activity . This metric, which measures the total value of all bitcoins at the price they were last moved, provides insight into long-term holder behavior and market sentiment.
The sustained decline in realized cap suggests that long-term holders are capitulating or moving their assets to cold storage, reducing the liquid supply available for trading. This dynamic can create both challenges and opportunities for price recovery, depending on whether new buyers step in to absorb the selling pressure.
Bitcoin's Relationship with Traditional Markets
Bitcoin's historical correlation with traditional financial markets, particularly the S&P 500, has been a defining characteristic of its price action. However, this relationship appears to be breaking down, with Bitcoin showing the weakest correlation to stocks since the FTX era newsbtc.com.
This decoupling could represent a maturation of Bitcoin as an asset class, developing its own independent price drivers rather than simply amplifying movements in traditional markets. The divergence becomes particularly notable when considering that gold has climbed nearly 199% over five years while Bitcoin struggles to maintain its position bitcoinist.com.
Technical Resistance and Support Levels
The technical analysis reveals several critical price levels that will likely determine Bitcoin's near-term trajectory. The $69,700 resistance level, defined by historical supply and the 0.618 Fibonacci retracement, has proven to be a decisive barrier during corrective rallies coingape.com.
Below current levels, the $62,000 area represents a significant support zone that could provide a foundation for any potential recovery. The failure to maintain prices above $65,000 has reinforced the bearish technical structure, while the extreme oversold conditions suggest that a relief rally could materialize if selling pressure abates.
Institutional Architecture and Market Structure
The institutional architecture binding Bitcoin to traditional markets continues to evolve, creating both opportunities and challenges for price discovery. The digital gold narrative, which positioned Bitcoin as a hedge against inflation and currency debasement, faces scrutiny as gold itself performs strongly while Bitcoin struggles cryptoslate.com.
The market structure has become increasingly complex, with institutional players, retail investors, and algorithmic trading systems all contributing to price dynamics. The breakdown in traditional correlations suggests that new market participants may be entering the space with different investment theses and time horizons.
Future Outlook and Key Considerations
The interplay between Bitcoin's price decline, US dollar strength, and central bank divergence creates a complex environment for investors. Several key factors will likely determine the market's direction in the coming months:
- The trajectory of US monetary policy and its impact on the dollar's strength
- The ability of Bitcoin to establish new support levels and reverse the current downtrend
- The restoration of stablecoin liquidity and its effect on market depth
- The return of institutional capital through positive ETF flows
- The resolution of the current oversold conditions and potential for a relief rally
The current market environment bears some similarities to previous bear markets, but also exhibits unique characteristics. The breakdown in correlation with traditional markets, the extreme oversold conditions, and the continued accumulation by whales all suggest that the current decline may be approaching a conclusion, though the timing remains uncertain.
Conclusion: Navigating Uncertainty in a Complex Market
Bitcoin's current price decline represents a complex interplay of technical, fundamental, and macroeconomic factors. The strengthening US dollar, divergent central bank policies, institutional capital flight, and declining stablecoin liquidity have all contributed to the current market conditions. However, the breakdown in traditional correlations, extreme oversold conditions, and continued whale accumulation suggest that the market may be approaching a significant inflection point.
Investors must navigate this uncertainty by considering multiple timeframes and risk factors. While the short-term technical picture remains challenging, the longer-term fundamentals of Bitcoin as a decentralized digital asset with growing institutional adoption continue to provide a foundation for potential recovery. The key will be identifying the catalysts that could reverse the current downtrend and restore positive momentum to the market.
As the market continues to evolve, the relationship between Bitcoin, traditional financial markets, and macroeconomic factors will likely become increasingly complex. Understanding these dynamics and their implications for price action will be crucial for investors seeking to navigate the current market environment and position themselves for future opportunities.